Archive for April, 2013
2 Notable 52wk HIGHS [EOD20130404] $TFX $MON $$
Posted by stubbybrown in 52 week highs on 2013/04/04
2 Notable 52wk HIGHS Screened & Ranked By Desc % YTD Price Performance:
ticker symbols:
TFX MON (<— quotes by stocktwits.com)
rank by performance %YTD after screening:
No.,Ticker,Company,Sector,Industry,Country,Market Cap,Perf YTD,Price,Change
1,TFX,Teleflex Incorporated,Healthcare,Medical Instruments & Supplies,USA,3.50B,20.14%,85.31,0.98%
2,MON,Monsanto Co.,Basic Materials,Agricultural Chemicals,USA,56.66B,12.56%,105.74,1.18%
http://bit.ly/10AoWN6 (<— finviz.com charts & news)
screening method:
1. first, using these following 11 finviz screen criteria:
- positive institutional transactions
- short float <5%
- gap up
- performance1 today up
- performance2 YTD +10%
- above 20dma
- above 50dma
- above 200dma
- 52wk high
- relative volume over 100%
- price over $50
2. second, i screened the list further using the following IBD criteria:
- composite rating 80 or greater
- eps rating rating 70 or greater
- rs rating rating 80 or greater
3. third, ranked the resulting list by %YTD price performance.
disclosure: i am long TFX
Economic reports (wed 20130403) – MBA Purchase Applications, ADP Employment Report, ISM Non-Mfg Index
Posted by stubbybrown in Economic Reports on 2013/04/03
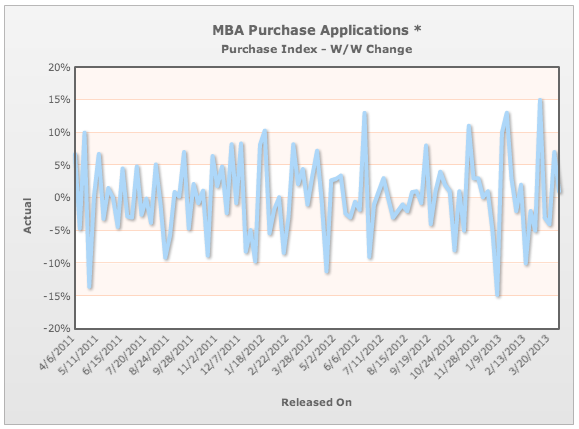
MBA Purchase Applications: Released On 4/3/2013 7:00:00 AM For wk3/29, 2013
- Highlights – A scheduled hike in FHA premiums on April 1 increased demand for government loans and gave a boost to purchase applications in the March 29 week, according to the Mortgage Bankers Association … <click link to read more>
- Composite Index – W/W Change, Prior 7.7%, Actual 4.0 %
- Purchase Index – W/W Change, Prior 7.0%, Actual % -1.0 %
- Refinance Index – W/W Change, Prior 8.0%, Actual -6.0 %

ADP Employment Report: Released On 4/3/2013 8:15:00 AM For Mar, 2013
- Highlights – ADP data are strongly signaling weakness for Friday’s employment report. Private payrolls by ADP’s count rose only 158,000 in March which is far below ADP’s 237,000 count for February (revised)
- Prior 198,000
- Prior Revised 237,000
- Consensus 205,000
- Consensus Range 170,000 to 240,000
- Actual 158,000

- Note – all credits to bloomberg.econoday.com
ISM Non-Mfg Index: Released On 4/3/2013 10:00:00 AM For Mar, 2013
- Highlights – Employment is the weak link in March’s non-manufacturing from the ISM whose headline composite index fell 1.6 points to a 54.4 level that indicates the slowest rate of monthly growth since July last year … <click link to read more>
- Prior 56.0
- Consensus 56.0
- Consensus Range 54.0 to 56.5
- Actual 54.4

- Note – all credits to bloomberg.econoday.com

6 Notable 52wk HIGHS [EOD20130402]
Posted by stubbybrown in 52 week highs on 2013/04/02
6 Notable 52wk HIGHS Screened & Ranked By Desc % YTD Price Performance:
ticker symbols: FLT, BIIB LIFE BDX RYN DVA (<— quotes by stocktwits.com)
rank by %YTD performance after screening: http://bit.ly/12eoCVv (<— finviz.com charts & news)
- + 45.07% YTD, FLT, FleetCor Technologies, Inc.
- + 35.40% YTD, BIIB, Biogen Idec Inc.
- + 34.10% YTD, LIFE, Life Technologies Corporation
- + 24.20% YTD, BDX, Becton Dickinson and Company
- + 15.32% YTD, RYN, Rayonier Inc.
- + 15.08% YTD, DVA, DaVita, Inc.
screening method:
1. first, using these following 11 finviz screen criteria:
- positive institutional transactions
- short float <5%
- gap up
- performance1 today up
- performance2 YTD +10%
- above 20dma
- above 50dma
- above 200dma
- 52wk high
- relative volume over 100%
- price over $50
2. second, i screened the list further using the following IBD criteria:
- composite rating 80 or greater
- eps rating rating 70 or greater
- rs rating rating 80 or greater
3. third, ranked the resulting list by %YTD price performance.
3 Notable 52wk HIGHS [EOD20130401]
Posted by stubbybrown in 52 week highs on 2013/04/01
3 Notable 52wk HIGHS Screened & Ranked By Desc % YTD Price Performance:
ticker symbols: FLT, UHS, BIIB (<— quotes by stocktwits.com)
rank by %YTD performance after screening: http://bit.ly/XDwGAj (<— finviz.com charts & news)
- FLT, FleetCor Technologies, Inc., + 43.97%
- UHS, Universal Health Services Inc., + 34.38%
- BIIB, Biogen Idec Inc., + 31.70%
screening method:
1. first, using these following 11 finviz screen criteria:
- positive institutional transactions
- short float <5%
- gap up
- performance1 today up
- performance2 YTD +10%
- above 20dma
- above 50dma
- above 200dma
- 52wk high
- relative volume over 100%
- price over $50
2. second, i screened the list further using the following IBD criteria:
- composite rating 80 or greater
- eps rating rating 70 or greater
- rs rating rating 80 or greater
3. third, ranked the resulting list by %YTD price performance.
-
You are currently browsing the archives for April, 2013
Meet Stubby
my name is michael james. my aim is to articulate my wall street trading thesis and methodology as an individual trader. all trading i do is in my own SEP-IRA account. all content i post is for information & opinion purposes only and not intended to be investment advice.
STUBBY RSS FEED

