Archive for category Commentary
out of the market
Posted by stubbybrown in Commentary on 2013/06/04
the market needs to correct and re-assemble a new global growth thesis. from a technical stand point, the market had gotten extremely overbought over the last couple of weeks. let’s see what the next several weeks bring.
ugly market conditions $SPX $DJIA $COMPQ $STUDY
Posted by stubbybrown in Commentary, Portfolio, Technical Alerts on 2013/05/31
today i unloaded a number positions as it’s possible the market is heading toward a correction (down 10% or more from recent high is technically what a correction amounts to). if i had done nothing, the portfolio only dropped by 0.78% while
- $SPX dropped 1.43%
- $DJIA dropped by 1.36%
- $COMPQ dropped by 1.01%
- MORNINGSTAR LARGE VALUE $MLVL dropped 1.57%
- MORNINGSTAR LARGE CORE $MLCR dropped by 1.52%
- MORNINGSTAR LARGE GROWTH $MLGR down by 1.27%
- MORNINGSTAR MID VALUE $MMVL down by 1.19%
- MORNINGSTAR MID CORE $MMCR down by 1.22%
- MORNINGSTAR MID GROWTH $MMGR down by 1.22%
- MORNINGSTAR SMALL VALUE $MSVL down by 0.72%
- MORNINGSTAR SMALL CORE $MSCR down by 0.8%
- MORNINGSTAR SMALL GROWTH $MSGR down by 1.09%
- see market barometer @ http://www.morningstar.com/

this weekend i’ll provide a little detailed analysis and update my portfolio holdings.
16 stubbystock new 52wk HIGHS [EOD20130516]: $CAB $TRIP $VRTS $GMCR $OCN $WDR $ARMH & more including ATHs
Posted by stubbybrown in 52 week highs, ATH, Commentary on 2013/05/16
notes:
- Stock Screener Listing sorted by perfytd
- 20130516_new_52wk_highs_and_new_aths from barchart.com
- 4 did NOT make the ATH list but were new 52wk highs: GMCR BDC JPM PNC
ranking by IBD SmartSelect rating, EPS rating, RSI rating in that order. (listing in csv format)
Rank No.,Symbol,Company Name,Composite Rating ,EPS Rating,RS Rating,SMR Rating,Acc/Dis Rating,Group Rel Str Rating,ATH
1,GMCR,Green Mtn Coffee Roastrs,99,99,99,A,A+,A+,NO
2,TRIP,TripAdvisor Inc,99,97,93,A,B+,B-,YES
3,VRTS,Virtus Investment Ptnrs,99,80,99,A,A,A,YES
4,CAB,Cabelas Inc,99,96,95,B,B,A,YES
5,OCN,Ocwen Financial Corp,98,98,96,A,A+,C-,YES
6,ARMH,A R M Holdings Plc Ads,97,96,94,A,C,B,YES
7,WDR,Waddell & Reed Finl Cl A,97,89,89,A,C+,A,YES
8,BDC,Belden Inc,96,83,89,B,B+,B-,NO
9,ULTI,Ultimate Software Group,96,97,83,A,B,B,YES
10,TYL,Tyler Technologies Inc,96,90,93,A,A,C-,YES
11,N,Netsuite Inc,95,74,96,B,A-,B,YES
12,JJSF,J & J Snack Foods Corp,88,95,84,B,A-,C+,YES
13,FEIC,F E I Co,84,87,83,B,B+,D+,YES
14,JPM,J P Morgan Chase & Co,80,95,78,C,C,C,NO
15,PNC,P N C Financial Svcs Grp,74,81,61,B,B+,C+, NO
16,ASML,A S M L Holding N.V. NY,72,51,82,B,B+,C+,YES
$GMCR – top stubbystock chart & commentary
- recent price behavior looking like a bear flag. i sold 3/4 position today in case the market rolls over in the next few days. but chart pattern very similar to dec-2012. 10DMA price action could trade flat for a few weeks. will be looking at STOC, MACD & other indicators for adding back in. i like this name long-term.

brief trading and market summary for 20130501 $LNKD $TYX $TLT
Posted by stubbybrown in 52 week highs, Commentary on 2013/05/01
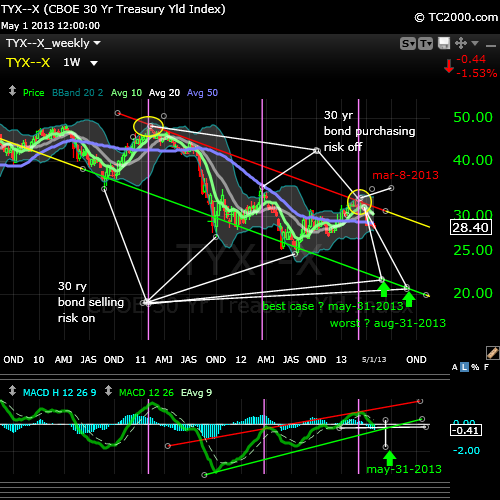
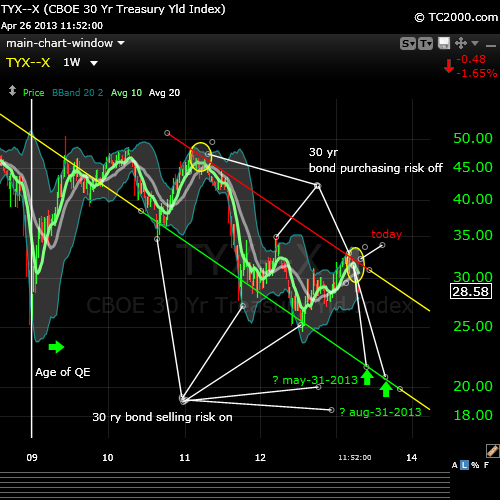
CBOE 30yr T-bond treasury yield index
- since my previous post on this subject, i have moved my est out when 30yr T-bond yield index $TYX would bottom from may-31-2013 to jun-14-2013.

notable 52 week highs
- i have 1 notable high to mention based on my rather stringent criteria: $LNKD
- i held $LNKD until today and sold for a good gain. great stock, great company but i’m bearish cyclical & aggressive growth equities & the major equity indexes until treasury yields reverse direction. i’ll look to possibly get back in $LNKD at that point.


trading outlook & equity positions
- again, for the near-term, i’m bearish major equity indexes as well as cyclical & aggressive growth sectors in particular until there’s more visibility with interest rates change momentum going back higher. i am long a few remaining equities at the moment (see finviz charts & data): $AMT $ANSS $ASML $AXP $C $CCI $CHD $DE $DTE $DXPE $GMCR $HES $PAA $PNC $PVH $TDG $TGI $TRIP. i may add to defensive related equities like consumer staples, health care, utilities & such.
- i am short-term long the following bond related etfs (see finviz charts & info): $BOND $LQD $LTPZ $PDI $TLT and will likely add to them on dips of these holdings until risk-on sentiment has returned to the market – when bond yields change momentum.
a short-term bearish equity market outlook $SPX $DIA $QQQ
Posted by stubbybrown in Commentary, Technical Alerts on 2013/04/27
during the remainder of this quarter, equity markets are likely to be under some selling pressure. this thesis is based on the historical pattern of rising and falling US 30yr T-bond yields which influence equity market sentiment changes from risk-on and risk-off. however longer-term, my outlook toward equities is constructive. the charts i’ve included help illustrate my thesis.
CHART #1 – making the case that longer-term uptrend market sentiment in equities is still intact
- LEGEND:
- US 30yr T-bond yield index $TYX–X (candlestick) vs SP500 $SPX (yellow trace)
- $TYX–X bond yield and $SPX price (y-axis) are logarithmic
- timeframe (x-axis): 1997 to present. each candlestick bar represents a quarter year
- overlays: bond yield index quarterly moving averages 10 (green), 20 (grey), 50( blue), 100 (magenta)
- overlays: bollinger band (light blue)
- pre & post quantitative easing by the federal reserve $FED is demarcated by the white vertical line

- COMMENTARY:
- the 2 white circles (w/red arrows over top the blue curve) to the left of the white line (denoting pre-FED QE) indicate the level of the 30 yr bond yield index $TYX–X when 2 market crashes commenced. bond yields move inversely to bond prices. when institutions, investors and traders start buying 30yr T-bonds at an increasing rate, it’s a good indication sentiment has changed and risk is to the downside for equities. when $TYX–X yield index levels approached the 50 quarter moving average (blue curve), a sell-off in equities commenced as investor sentiment got extremely bearish. the first crash is the familiar DOT COM bubble burst and the second crash is when the federal government let LEHMAN BROTHERS investment banking institution fail.
- in oct-2008 the ripple effect of the LEHMAN failure was so systemic & global in scope, essentially all banks national & foreign stopped lending money to each other over night creating a liquidity freeze. it was later coined that banks of LEHMAN’s size were too big to fail and the treasury & federal reserved stepped in to unfreeze lending to restore market confidence. the correlation between the 50 quarter moving average of the 30yr bond index is coincidental and not causal imo.
- in nov-2008, the federal reserve instituted quantitative easing (QE which entails bond purchases by the federal central bank) drove bond prices up and lowered interest rates aided by even other facilities the $FED rolled out. the intent of the $FED was also to make bond prices so expensive, market participants would stop buying bonds for safety and seek greater capital appreciation potential in the equites market and restore confidence in the financial system.
- knowing that the $FED was underneath everyone else buying bonds, equity capital markets eventually re-gained confidence and investors started selling their bonds. as such bond prices dropped and bond yields rose. notice 2 times after QE commenced, yields approached the 50 quarter moving average mark and equities began selling off again. these events were precipitated by different market events. so increased bond buying commenced by the $FED (extending QE) in an effort once again to confidence.
- the second big drop in equity prices (after QE commenced) was subsequent to the 3 big credit rating agencies lowering the credit worthiness of the US treasury from AAA to AA+, the first ratings drop in recent memory. but after yields dropped to certain levels, the magnitude of bond yield index oscillation has significantly reduced establishing a lid on volatile interest rate changes. note the spread between current bond yield index and it’s 50 quarter moving average has remain wide and relatively flat.
- therefore it is reasonable to conclude that bond yields are not forecasting an imminent crash in the stock market. hence a longer-term bullish market thesis remains intact. however, the relationship between bond yields & equity risk aversion is still an influence on investor sentiment, even on a small scale. using CHART #2 is how i present my short-term bearish equity market thesis.

CHART #2 – making the case for short-term equity bearishness and jitters.
- LEGEND
- US 30yr T-bond yield index $TYX–X (candlestick) vs SP500 $SPX (yellow trace)
- $TYX–X bond yield and $SPX price (y-axis) are logarithmic
- timeframe (x-axis): end of 2008 to present. each candlestick bar represents a week.
- overlays: bond yield index weekly moving average 10 (green), 20 (grey)
- overlays: bollinger bands (light blue)
- pre & post quantitative easing by the federal reserve $FED is demarcated by the white vertical line

- COMMENTARY:
- this charts shows another but similar set of trend lines encapsulating the 10 week moving average of the 30 yr T-bond yield index. each time yields begin to drop (indicating increase in bond purchases) there’s a corresponding risk aversion to equities (trace not shown). once the bond yield index peaks and retreats, there’s an increased downward pressure on equity prices. nothing moves in a straight line, though sometimes it may seem so. there can be significant changes from day to day but the moving averages pretty much tells the same story from a market direction standpoint.
- when the 10 week moving average (green) crossed down the 20 week moving average (grey), it was predictable equity markets would drop over a period of several weeks, sometimes months. this pattern occurred all but one time the 10 week & 20 week moving average crossed. right after the 2012 presidential election, the 10 week yield moving average bounced higher off the 20 week moving average as support. today the 10 week moving average is crossing down the 20 week moving average. based on the number of times (5) the 10 week crossed the 20 week moving average, 4 out of five times equity markets took a noticeable breather.
- therefore it is probable and more likely equity markets will fade downward to the point in time (green arrows) bond yields retreat upward. however it is still possible but less likely the 10 & 20 week bond yield moving averages pierce through the upper trend-line and markets begin another leg higher outside the trend.
- all this sounds like weather predictions, i know. but these tools help traders stay alert to potential market sentiment changes in a measured way.
CONCLUSION: i have not begun to short the broader equity market. in the passed there have been a couple of ways i achieved that. (1) through purchasing inverse and inverse leveraged market index etfs OR through purchase of volatility etns. (2) if i don’t short the market but still want some protection, i’ll raise cash ahead of a perceived slow down by taking profits off the table and purchasing various bond related etfs whether treasuries or corp investible bond etfs. recently i’ve taken a higher position in bonds than normal for me in the following bond related etfs: $BOND $LQD $LTPZ $PDI $TLT. they comprise 20% of invested holdings vs 80% equities. and about 22% of my grand total account holdings is cash. let’s see what the future holds over the next 4 – 16 weeks.
-
You are currently browsing the archives for the Commentary category.
Meet Stubby
my name is michael james. my aim is to articulate my wall street trading thesis and methodology as an individual trader. all trading i do is in my own SEP-IRA account. all content i post is for information & opinion purposes only and not intended to be investment advice.
STUBBY RSS FEED


Learning Techniques in Swing Trading
Posted by stubbybrown in Commentary on 2014/02/21
Greetings all to 2014!
Since September 2013, I’ve been implementing and tweaking techniques in swing trading versus position investing. Swing trading is not day trading but holding periods for swing traders can be anywhere from less than a day to several months. I found this style of trading to be more suitable and rewarding to me personally.
Everything I’ve learned prior to changing styles of trading is still pertinent and very applicable to swing trading. The biggest difference between the two styles of investing/trading is that time frames to make decisions are more compressed with swing trading. Secondly, the swing trader must be willing to take on more risk and volatility. So understanding and determining risk/reward is critical to achieving success in addition to establishing well defined entries and exits ahead of entering a position.
I have been using Worden TC2000 (currently ver 12.4) to develop (1) watch lists designed for swing trading, (2) using alerts based on a variety of technical conditions more frequently and (3) developing my own scans to find stocks with the greatest potential to meet my goals. If I can explain my methodology in simple enough terms to help somebody, I will have achieved my ultimate goal in maintaining this blog. Shout out to all my friends and colleagues at StockTwits and Twitter who have liberally shared their insights with me to progress to this point.
MJ
Leave a comment