Archive for May 22nd, 2013
the last remaining stubbystocks [EOD20130522] $ACT $DPZ $GILD $ICON $PAA $SAIA $TBT $TYL $UHS $UNF $VAL $WAB
Posted by stubbybrown in Portfolio on 2013/05/22
charts & quotes:
- finviz.com
- all equities ranked below in line with stubby’s IBD screen criteria. TBT is Proshrs Ultsht 20+ Yr etf.
No.1 rank chart and commentary:

- highest ranked: PAA
- today i unloaded a lot of holdings, some for profit and some for loss. DPZ, ICON may wind up going because their float short percentages are higher than i like respectively: 6.19%, 23.25%.
- ACT: hourly chart – exhibiting standing bear with claws up high. my way of saying bear flag. conceivably could drop to 120.
- DPZ: daily chart – looking decent. could make a run for it’s 50DMA now @ 52.98.
- GILD: daily chart – looking decent. could make a run for it’s 50DMA now @ 50.53.
- ICON: daily chart – exhibiting standing bear with claws up high. could make a run for it’s 50DMA now @ 26.82.
- PAA: daily chart – behaving pretty well. fairly tight MACD range. could make a run for it’s 200HRMA now @ 57.56.
- SAIA: daily chart – a little bear claw looking. conceivably could drop to 40.
- TYL: daily chart – a little bear claw looking. conceivably could drop to 63.
- UHS: daily chart – near decent looking support level between current price and 65.
- UNF: daily chart – near decent looking support level between current price and 94.10.
- VAL: daily chart – a little bear claw looking. conceivably could drop to 68.
- WAB: daily chart – actually looks in a bull flag formation. solid support starts kicking in @ 107.5.
2 notable 52wk HIGHS [EOD20130522] $BIIB $JPM
Posted by stubbybrown in 52 week highs on 2013/05/22
charts & quotes
- finviz.com
- stubby’s notable screen criteria is based on technical & fundamental parameters.
ranked table of highs
No.1 rank chart and commentary
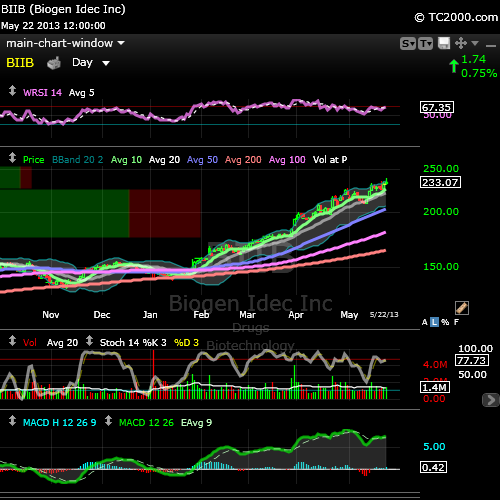
- based on my screening criteria, neither of these 2 stocks would have made the notables were it a normal day on wall street. BIIB & JPM did not close above the previous 52wk (or all time high if that is the case.) not much was normal on wall street today. more on that in another post.
- having said that, these 2 stocks did hold up rather well considering the extreme selling pressure on the market as a whole. a look at BIIB’s chart and what jumps out MA divergence is around 52 wk highs. this leaves BIIB somewhat vulnerable to additional selling pressure if investors and traders decide in the next few days it’s time to take profits. we’ll just have to wait and see.
- so i have no plans to get into BIIB at the moment. it might be wise to consider taking some profits before the street forces the trade. my status on BIIB would be SELL some if profits are high and hold otherwise. i’d like to see MACD come in and revert to mean some.

-
You are currently browsing the archives for Wednesday, May 22nd, 2013
Meet Stubby
my name is michael james. my aim is to articulate my wall street trading thesis and methodology as an individual trader. all trading i do is in my own SEP-IRA account. all content i post is for information & opinion purposes only and not intended to be investment advice.
STUBBY RSS FEED

