Archive for category ATH
Shaving $AET down to size
Posted by stubbybrown in ATH, Case Studies on 2014/06/29
Name: Aetna Inc
Sector/Industry: Healthcare/ Healthcare Plans
Thesis: a long track record of solid fundamentals and accretive acquisitions has set Aetna up to be one of if not the top health insurance provider in the U.S. Top dividend grower.
Next earnings date: ~ July 29, 2014 before market opens
Risk: Medium to low: PE 14.4, forward PE 11.39, PEG 1.49
Portfolio status/Position: Core/Entry position
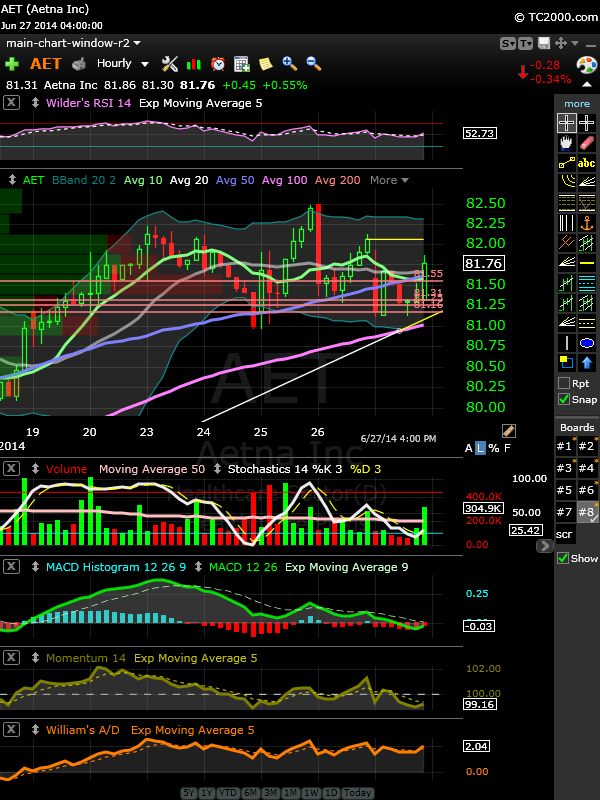
Last trades: Jun-26-sell @ 81.55, Jun-26-sell @ 81.31, Jun-27-sell @ 81.16, Jun-27-sell @ 81.25
Barchat.com Alpha Weighted Index: 33.20
Technical trading their: Middle
Chart Analysis: Over the last few days I have shaved down my position in AET from full position to entry level. In tandem with the S&P 500, AET has made new all-time highs while reverting to the mean. The chart below shows price levels I sold chucks of stock. Chart also shows the supporting trend line AET has fallen back to. My Price target is $85 – $87 based on analysts projections. Given the run steep slope of trajectory, I will buy & sell opportunistically but will not grow the position back to full size until more significant correction and mean reversion from the down side.
Other names I currently own are: $GTAT $AKRX $PPC TRN $MPAA $ITMN $LNC $OXY
20140621 $OXY weekly wrap
Posted by stubbybrown in 52 week highs, ATH, Portfolio on 2014/06/21
Name: Occidental Petroleum Corp
Sector/Industry: Energy/Oil & Gas Exploration & Production
Thesis: $OXY beat last earnings estimates by $0.05 on May 5, 2014. Spinning off California assets into independent E&P seen favorable by the market sheading focus on parent company global backlog, increasing earnings growth and steadily growing dividend.
Next earning date: 7/30/14 *Est.
Risk: Low with P/E 1/2 of sector peers.
Portfolio status: Bedrock/Anchor. Level of investment is full. Buying strategically only on dips more than 5% below most recent 52 week high.
Last trades: On 20140617 buy @ 102.35, on 20140613 buy @ 101.93.
All time high/52 week high: $117.89 May of 2011 /$104.14 on June 21, 2014
Price target: $115
Technical trading tier: Lowest
Chart Analysis: Weekly chart below shows $OXY is just about reached a level of resistance drawn at 104.36. Levels are based on prices going back a ways based on much different boundary conditions on the economy. Levels should be taken with a grain of salt. So this is trading approach I’m implementing. Watch the hourly charts and in particular when MACD Xup it’s signal. If stochastics Xup 80, consider that a signal to buy if stochastics Xdown 80 for a short period time and Xup 80 very soon after. Look for daily MACD Xup, daily stochastic Xup for confirmation.

2 notable 52wk HIGHS [EOD20130516] $VRTS $TYL both ATHs
Posted by stubbybrown in 52 week highs, ATH on 2013/05/16
screen results:
- stubby’s screen results @ finviz.com.
- stubby’s screen criteria is based on technical & fundamental parameters.
- all time highs: $VRTS $TYL
rank results: (csv format)
Rank no.,Symbol,Company Name,Composite Rating,EPS Rating,RS Rating,SMR Rating,Acc/Dis Rating,Group Rel Str Rating,ATH
1,VRTS,Virtus Investment Ptnrs,99,80,99,A,A,A,Y
2,TYL,Tyler Technologies Inc,96,90,93,A,A,C-,Y
charts:


list of 20 stubbystocks making new all time highs: $MDSO $VRTS $TRIP $LFG $URI and more
Posted by stubbybrown in 52 week highs, ATH on 2013/05/15
- link to finviz.com charts
- checked against the ATH list @ barchart
- the spreadsheet of todays ATH list:
US_Exchanges_All_Time_Highs – 05_15_2013 - stubby stocks making 52wk highs but not all time highs: $AXP $BDC $BMY $CBRL $IBB $JPM $PNC $TM $WAG $XLP
- list below is ranked & sorted by IBD composite rating:
Rank no.,Symbol,Company Name,Composite Rating _,EPS Rating,RS Rating,SMR Rating,Acc/Dis Rating,Group Rel Str Rating
1, MDSO,Medidata Solutions Inc,99,90,98,A,A-,A
2, VRTS,Virtus Investment Ptnrs,99,80,99,A,A,A
3, TRIP,TripAdvisor Inc,99,97,92,A,B+,C+
4, LGF,Lions Gate Entertainment,99,80,97,D,A+,A+
5, URI,United Rentals Inc,98,74,89,A,B-,A-
6, CAB,Cabelas Inc,98,96,94,B,B-,B+
7, GILD,Gilead Sciences Inc,98,77,96,A,A-,A+
8, MIDD,Middleby Corp,98,90,85,A,A-,B+
9, ARMH,A R M Holdings Plc Ads,97,96,94,A,C+,B
10, WDR,Waddell & Reed Finl Cl A,96,90,89,A,C,A
11, UHS,Universal Health Svcs B,96,87,93,B,A-,A+
12, ULTI,Ultimate Software Group,96,97,82,A,B,B
13, SAIA,Saia Inc,95,75,98,C,A+,A
14, ICON,Iconix Brand Group Inc,94,86,94,B,A-,C
15, CBRL,Cracker Barrl Old Cnt St,93,82,89,B,B,A+
16, TDG,Transdigm Group Inc,89,82,70,A,C+,A-
17, JJSF,J & J Snack Foods Corp,87,95,82,B,B+,C+
18, FEIC,F E I Co,85,87,81,B,B+,C-
19, KUB,Kubota Corp Adr,83,74,96,C,C-,B-
20, ASML,A S M L Holding N.V. NY,73,51,82,B,B+,B-
top ranked $MDSO daily stock chart

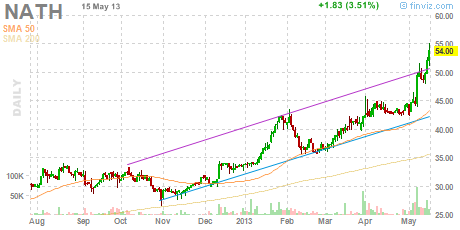
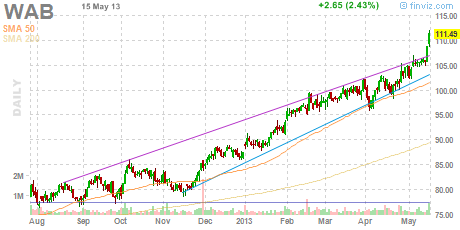
6 notable 52wk HIGHS [EOD20130515] $ADP $GILD $GOOG $NATH $VAL $WAB
Posted by stubbybrown in 52 week highs, ATH on 2013/05/15
results: (csv format)
- finviz.com chart list is by alphabetical order. stubby’s ranking is below:
- my screening criteria is based on technical & fundamental parameters i find at finviz.com & IBD investors.com.
- all below made new all time highs.
- $NATH $VAL make the list of 52wk highs and all time highs 2 days in a row.
Rank no.,Symbol,Company Name,Composite Rating,EPS Rating,RS Rating,SMR Rating,Acc/Dis Rating,Group Rel Str Rating
1,GOOG,Google Inc,99,91,83,A,B,A+
2,GILD,Gilead Sciences Inc,98,77,96,A,A-,A+
3,WAB,Wabtec,96,92,85,A,B,A
4,NATH,Nathans Famous Inc,96,84,97,A,A-,A+
5,VAL,Valspar Corp,88,81,83,B,A,B-
6,ADP,Automatic Data Processng,88,70,78,A,A-,B


new category: stubby’s ALL TIME HIGH listing: long $AXP $CBRL $CBS $CCI $DDD $DPZ $MDSO $NSM $OCN $TRIP $UHS $ULTI $URI $WDR
Posted by stubbybrown in ATH on 2013/05/14
-
You are currently browsing the archives for the ATH category.
Meet Stubby
my name is michael james. my aim is to articulate my wall street trading thesis and methodology as an individual trader. all trading i do is in my own SEP-IRA account. all content i post is for information & opinion purposes only and not intended to be investment advice.
STUBBY RSS FEED


16 stubbystock new 52wk HIGHS [EOD20130516]: $CAB $TRIP $VRTS $GMCR $OCN $WDR $ARMH & more including ATHs
Posted by stubbybrown in 52 week highs, ATH, Commentary on 2013/05/16
notes:
ranking by IBD SmartSelect rating, EPS rating, RSI rating in that order. (listing in csv format)
Rank No.,Symbol,Company Name,Composite Rating ,EPS Rating,RS Rating,SMR Rating,Acc/Dis Rating,Group Rel Str Rating,ATH
1,GMCR,Green Mtn Coffee Roastrs,99,99,99,A,A+,A+,NO
2,TRIP,TripAdvisor Inc,99,97,93,A,B+,B-,YES
3,VRTS,Virtus Investment Ptnrs,99,80,99,A,A,A,YES
4,CAB,Cabelas Inc,99,96,95,B,B,A,YES
5,OCN,Ocwen Financial Corp,98,98,96,A,A+,C-,YES
6,ARMH,A R M Holdings Plc Ads,97,96,94,A,C,B,YES
7,WDR,Waddell & Reed Finl Cl A,97,89,89,A,C+,A,YES
8,BDC,Belden Inc,96,83,89,B,B+,B-,NO
9,ULTI,Ultimate Software Group,96,97,83,A,B,B,YES
10,TYL,Tyler Technologies Inc,96,90,93,A,A,C-,YES
11,N,Netsuite Inc,95,74,96,B,A-,B,YES
12,JJSF,J & J Snack Foods Corp,88,95,84,B,A-,C+,YES
13,FEIC,F E I Co,84,87,83,B,B+,D+,YES
14,JPM,J P Morgan Chase & Co,80,95,78,C,C,C,NO
15,PNC,P N C Financial Svcs Grp,74,81,61,B,B+,C+, NO
16,ASML,A S M L Holding N.V. NY,72,51,82,B,B+,C+,YES
$GMCR – top stubbystock chart & commentary
ARMH, ASML, BDC, CAB, FEIC, GMCR, JJSF, jpm, N, OCN, PNC, TRIP, TYL, ULTI, VRTS, WDR
Leave a comment