Posts Tagged AMGN
11 stubbystock 52wk highs $BIIB $CELG $AMGN $GILD $ECL $TWX $DIS $VIAB $ABC $SAM $BOND
Posted by stubbybrown in 52 week highs on 2013/04/22
finviz charts http://bit.ly/ZheL2c
top 5 stubbystock daily gainers for 2013-04-22 $BIIB $CELG $TGI $FLT $AMGN
Posted by stubbybrown in Top 5 Daily Gainers on 2013/04/22
- finviz.com charts http://bit.ly/15BP8wz
- BIIB CELG AMGN closed at new 52wk highs
stubbystock technical alert RSI xUP [EOD20130416] $AMGN $ASR $BRKB $CELG $CPA $DIS $GILD $HSY $SJM $TRIP $TWX $VIAB
Posted by stubbybrown in Technical Alerts on 2013/04/16
AMGN, ASR, BRKB, CELG, CPA, DIS, GILD, HSY, SJM, TRIP, TWX, VIAB – finviz charts & quotes http://bit.ly/13ilkkz
i am long these listed.

3 Notable 52wk HIGHS [EOD20130412] $GILD $BIIB $AMGN
Posted by stubbybrown in 52 week highs on 2013/04/12
3 Notable 52wk HIGHS Screened By Finviz & Ranked By IBD SmartSelect:
ticker symbols:
screening method:
1. first, using these following 13 finviz screen criteria:
- screen from all 6400+ stocks listed at finfiz.com
- must close above previous 52 wk high
- positive institutional transactions
- short float <5%
- gap up
- performance1 today up
- performance2 YTD +10%
- above 20dma
- above 50dma
- above 200dma
- 52wk high
- relative volume over 100%
- price over $50
2. second, i screened the list further using the following IBD criteria:
- composite rating 80 or greater
- eps rating rating 70 or greater
- rs rating rating 80 or greater
rank by my criteria using IBD SmartSelect: (csv format)
No.,Symbol,Company Name,Composite Rating,EPS Rating,RS Rating,
1,GILD,Gilead Sciences Inc,99,74,97,
2,BIIB,Biogen Idec Inc,97,84,94,
3,AMGN,Amgen Inc,97,86,93,
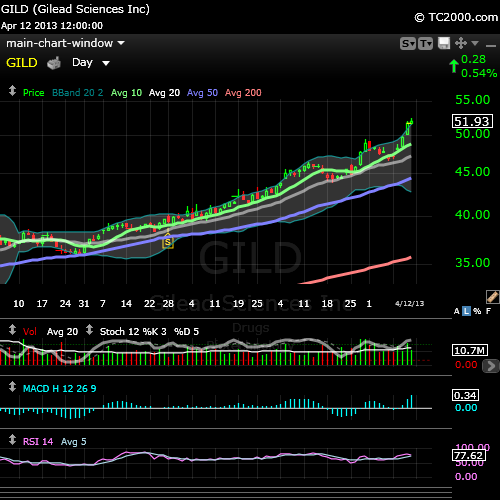
top ranked chart: $GILD
 –
–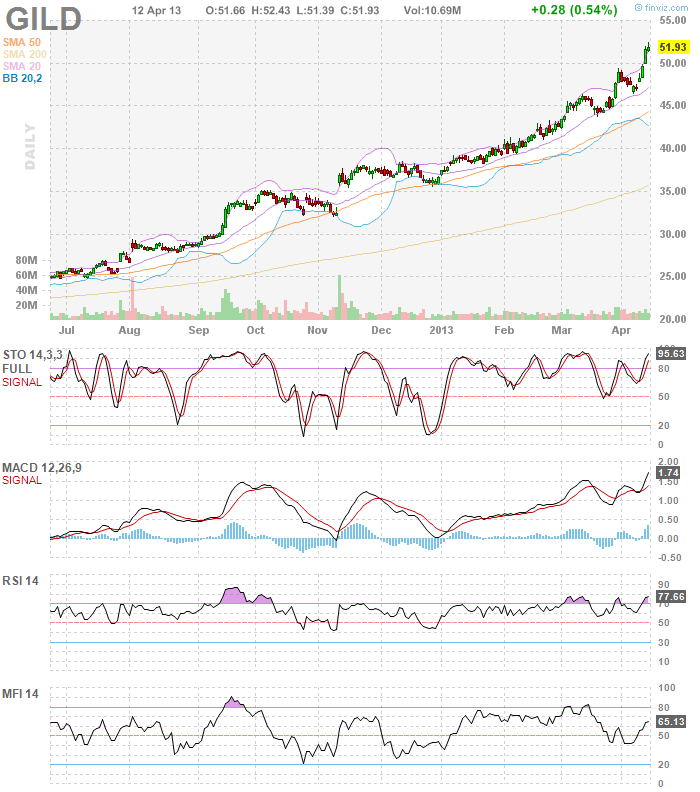
stubby’s chart commentary:
- a re-run from yesterday’s commentary: it’s really hard to put any kind of spin on a stellar stock chart like $GILD. but i’ll try. what i look for is price momentum with rising vol above average, rising RSI (added notes: moving average), rising accumulation and rising money flow. i also like to see a stock gap up over previous day close, making new highs during the day and closing above the previous 52 wk high. $GILD has it all.
- the major difference from today’s chart versus yesterday’s is today’s candlestick formation. yesterday’s candle was a long white formation which indicates strong price momentum higher. today’s candle formation was a white spinning top. typically this indicates sanguine neutrality, particularly in a clear uptrend chart pattern. some may see this as indecision or possible bearish behavior on the part of traders. with all the indications i pointed to in the prior bullet shows this to be buying in moderation in a clear uptrend mode.
- i have a full position in $GILD, cost @ 44.12. $GILD closed today @ 51.96, up 0.54% from yesterday’s close. i have no immediate plans to add to $GILD or trim it. sticking to my thesis this stock and other top biotechs will be market leaders for at least the next 9 – 12 mons. i will re-consider adding to or trimming $GILD after it reports earning later this month on about apr-24-2013.
disclosure(s):
Meet Stubby
my name is michael james. my aim is to articulate my wall street trading thesis and methodology as an individual trader. all trading i do is in my own SEP-IRA account. all content i post is for information & opinion purposes only and not intended to be investment advice.
STUBBY RSS FEED

