Posts Tagged NXPI
20140622 $NXPI – A technical case study and swing trade analysis
Posted by stubbybrown in Case Studies on 2014/06/22
Name: NXP Semiconductors NV
Symbol: NXPI – quote provided by Finviz
Location: Netherlands
Sector/Industry: Technology/General semiconductors
Barchart.com Weighted Alpha Index Value: 111.71
End of day Friday, June 20, 2014, my scans picked up a significant number of names (triggering bullish technical signals I watch for a regular basis) $NXPI being one of them. I’ll review my scanning techniques in another post, but this name triggered the following daily signals: daily STOCH Xup 80, vol > 50D ma, new 52 week high, new all time high. The following weekly signals were triggered as well: MACD signal Xup and Momemtum 14 Xup 5D ma. Not precisely sure when last week the weekly signals occurred. One of the tougher things about weekly signals but they are important too and not to be ignored nonetheless. More on that below.
Before I get too interested in a name just because it makes my scan and list inclusion criteria, there’s a number of things I do by looking at the chart to determine if this name is something worth paying more attention. In addition, I instituted a rule I follow which is to never to buy a name the following day I allow a name to jump on my top long watch list. I’ve gotten burned too many times buying right out of the gate. My general practice of swing trading is to buy or add on temporary short-term weakness, not strength.
In a nutshell, these are the steps I take before I populate a name on my top long watch list:
(1) Establish trend lines on the hourly, daily and weekly candle bar charts. Sometime I look at the 5 min and monthly charts.
(2) Look for and note near by support & resistance price points on the chart with yellow horizon lines.
(3) study the MACD & STOCHs first and note a pattern of oscillation with the MACD histogram study. I use Worden TC2000 for these studies are readily available. Valid MACD Xups are followed up or preceded by STOCH Xups in the same time frame. If a Xup is confirmed, I insert a white horizontal line at the close of the candle in that time frame.
(4) Then I watch for while and anticipate characteristic trending patterns based on the frequency of Xups I observed above.
(5) Only if the name meets the criteria to be included in my top watch list (another post), I’ll include it in the appropriate list.
(6) Some names trade with somewhat predictable regularity and if the pattern suites me, I may still follow the name and could decide to begin to accumulate shares at a future point of opportunity.
After doing the first 3 steps anyway, I came up with the following hourly candle bar chart:
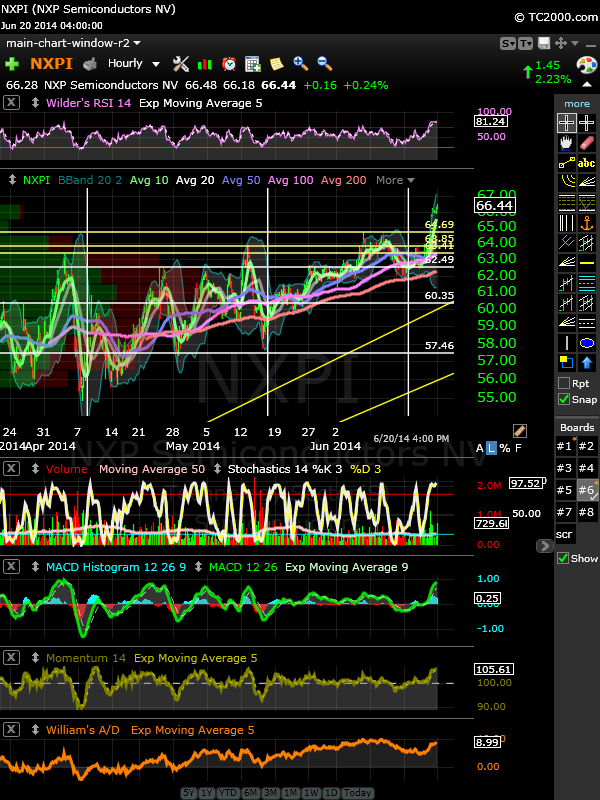
The yellow horizontal lines are lines of support based on recent tops. Eventually $NXPI will pull back. Depending on when, these lines will be first line of support before the name breaks down below the top most white horizontal line when the last MACD Xup occurred in this time frame.
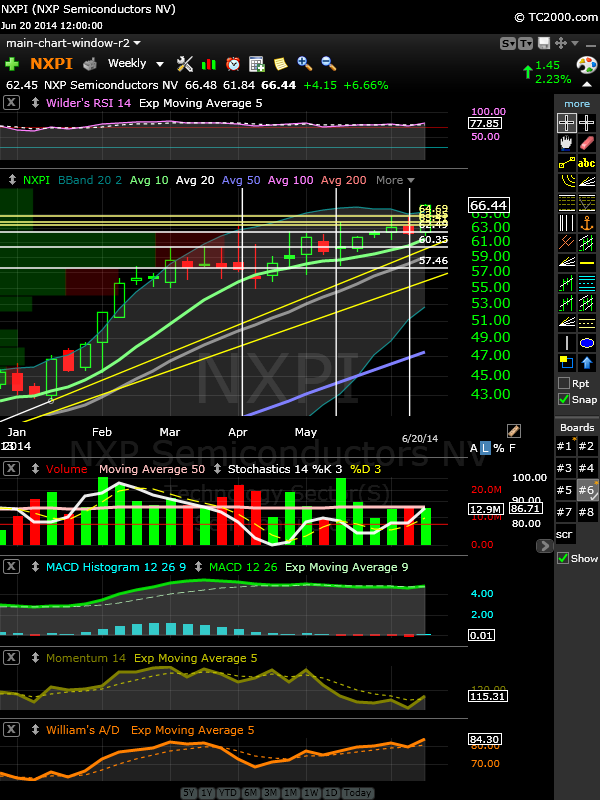
The weekly chart is interesting too. See below. Remember I noted $NXPI triggered it’s weekly MACD Xup signal and Momemtum 14 5D ma signal. Weekly Bollinger bands have tightened and the last weekly bar crossed up through the top BB, yet another bullish signal. So this name should be watched and is a prime candidate for entry on the next dip.
Meet Stubby
my name is michael james. my aim is to articulate my wall street trading thesis and methodology as an individual trader. all trading i do is in my own SEP-IRA account. all content i post is for information & opinion purposes only and not intended to be investment advice.
STUBBY RSS FEED

