stubbybrown
IT support and adjunct CS instructor.
Homepage: https://stubbybrown.wordpress.com
the last remaining stubbystocks [EOD20130522] $ACT $DPZ $GILD $ICON $PAA $SAIA $TBT $TYL $UHS $UNF $VAL $WAB
Posted in Portfolio on 2013/05/22
charts & quotes:
- finviz.com
- all equities ranked below in line with stubby’s IBD screen criteria. TBT is Proshrs Ultsht 20+ Yr etf.
No.1 rank chart and commentary:

- highest ranked: PAA
- today i unloaded a lot of holdings, some for profit and some for loss. DPZ, ICON may wind up going because their float short percentages are higher than i like respectively: 6.19%, 23.25%.
- ACT: hourly chart – exhibiting standing bear with claws up high. my way of saying bear flag. conceivably could drop to 120.
- DPZ: daily chart – looking decent. could make a run for it’s 50DMA now @ 52.98.
- GILD: daily chart – looking decent. could make a run for it’s 50DMA now @ 50.53.
- ICON: daily chart – exhibiting standing bear with claws up high. could make a run for it’s 50DMA now @ 26.82.
- PAA: daily chart – behaving pretty well. fairly tight MACD range. could make a run for it’s 200HRMA now @ 57.56.
- SAIA: daily chart – a little bear claw looking. conceivably could drop to 40.
- TYL: daily chart – a little bear claw looking. conceivably could drop to 63.
- UHS: daily chart – near decent looking support level between current price and 65.
- UNF: daily chart – near decent looking support level between current price and 94.10.
- VAL: daily chart – a little bear claw looking. conceivably could drop to 68.
- WAB: daily chart – actually looks in a bull flag formation. solid support starts kicking in @ 107.5.
2 notable 52wk HIGHS [EOD20130522] $BIIB $JPM
Posted in 52 week highs on 2013/05/22
charts & quotes
- finviz.com
- stubby’s notable screen criteria is based on technical & fundamental parameters.
ranked table of highs
No.1 rank chart and commentary
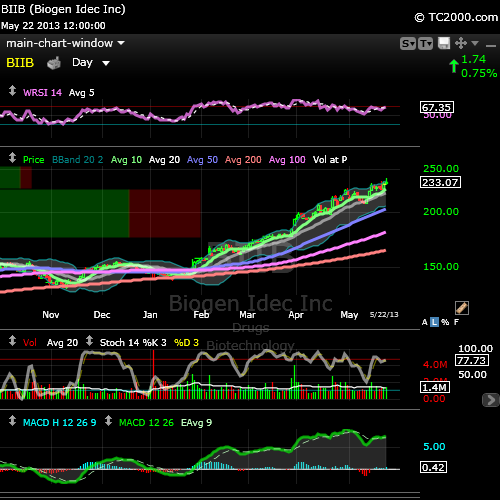
- based on my screening criteria, neither of these 2 stocks would have made the notables were it a normal day on wall street. BIIB & JPM did not close above the previous 52wk (or all time high if that is the case.) not much was normal on wall street today. more on that in another post.
- having said that, these 2 stocks did hold up rather well considering the extreme selling pressure on the market as a whole. a look at BIIB’s chart and what jumps out MA divergence is around 52 wk highs. this leaves BIIB somewhat vulnerable to additional selling pressure if investors and traders decide in the next few days it’s time to take profits. we’ll just have to wait and see.
- so i have no plans to get into BIIB at the moment. it might be wise to consider taking some profits before the street forces the trade. my status on BIIB would be SELL some if profits are high and hold otherwise. i’d like to see MACD come in and revert to mean some.

11 new stubbystock HIGHS [EOD20130521] $CVI $MIDD $JPM $PNC $SAIA $GS $AXP $ASML $TM $C $UNF
Posted in 52 week highs on 2013/05/21
charts & quotes
ranked table of highs
- stubby’s rank criteria based on IBD SmartSelect parameters.
No.1 rank chart and commentary
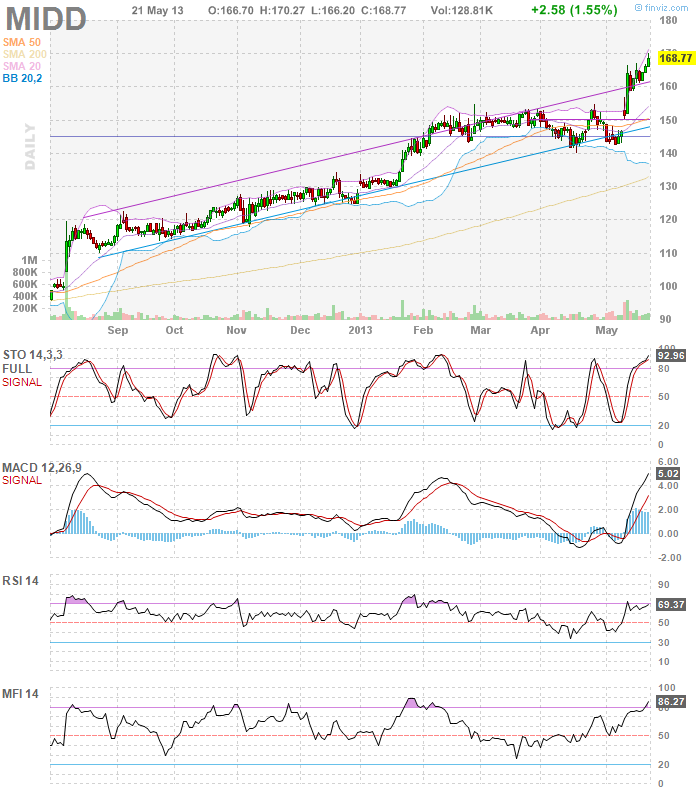
- Company Profile: Middleby Corp (MIDD) Company Description: MANUFACTURES A BROAD LINE OF COOKING AND WARMING EQUIPMENT USED IN HOTELS, RESTAURANTS AND OTHER INSTITUTIONS.
- MIDD has been one of my fav industrial stocks this year. currently listed as no. 1 leader in it’s category on IBD. the daily & weekly chart show MIDD has recently broken out. in the weekly timeframe, this is the second week of gaining higher since since breaking out of the box. MIDD looks to continue it’s charge higher.
- my current status for MIDD is HOLD until the stock exhibits to test the upper trend-line drawn in the finviz daily chart OR another MACD xUP on the daily chart.

other setups to watch in todays 52wk highs list
- as mentioned yesterday, CVI – breaking out through a resistance level of 65. if it pulls back, watch for support @ 66.13 in which case would make a good entry if bounces higher on high vol.
- JMP – status HOLD. new hrly support level(s) @ 52.00 & 51.01.
- PNC – status HOLD. new hrly support level(s) @ 71.16 & 70.35.
- SAIA – status HOLD. new hrly support level(s) @47.36 & 46.95.
- GS – status HOLD. new hrly support level(s) @ 157.44
- AXP – status HOLD. new hrly support level(s) @ 74.20 & 73.00
- ASML – status HOLD. new hrly support level(s) @ 77.52
- TM – status HOLD. new hrly support level(s) @ 127.60 & 122.53
- C – status HOLD. new hrly support level(s) @ 51.00 & 49.05
- UNF – status HOLD. new hrly support level(s) @ 95.50 & 94.51
2 notable 52wk HIGHS [EOD20130521] $AHGP $JPM
Posted in 52 week highs on 2013/05/21
charts & quotes
- finviz.com
- stubby’s notable screen criteria is based on technical & fundamental parameters.
ranked table of highs
No.1 rank chart and commentary
- this is the first time AHGP has come across my screen. i have no position but will be watching closely. there’s good support @ 60. if it comes in, i may snap up an entry pos.
 o
o
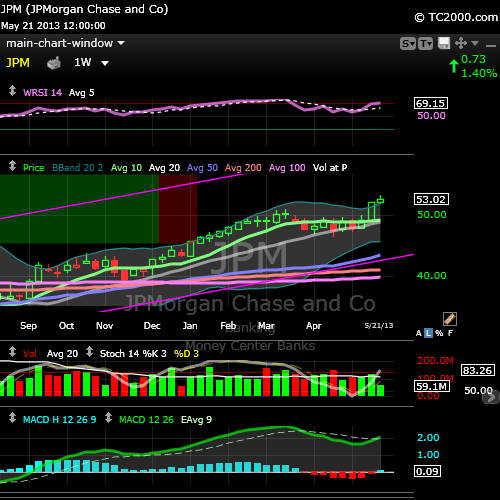
- JPM weekly MACD xUP this week. good entry point.

12 new stubbystock HIGHS [EOD20130520] $ACT $ASML $AXP $C $CBRL $CVI $GS $OCN $SAIA $TM $TRIP $VAL
Posted in 52 week highs on 2013/05/20
charts & quotes
ranked table of highs
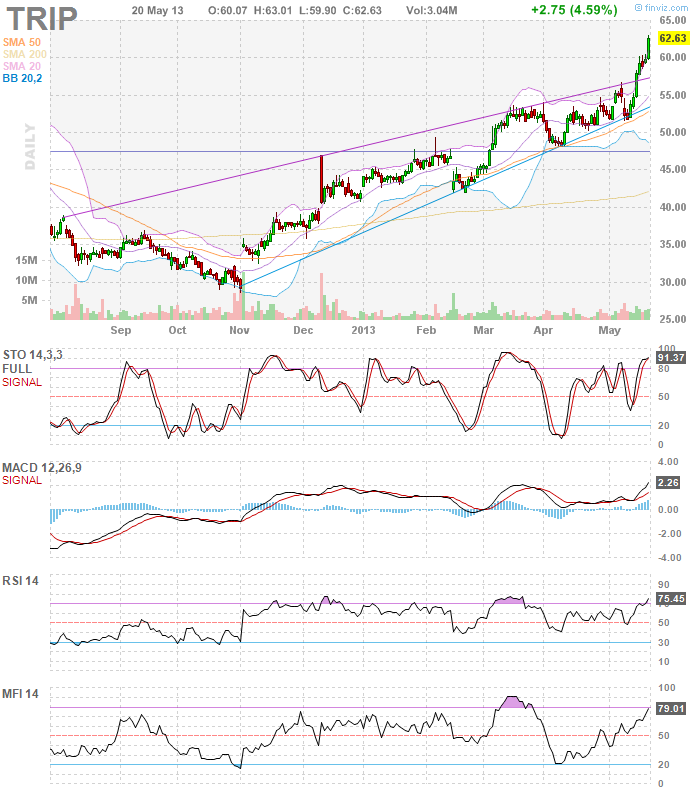
No.1 rank chart TRIP and commentary
- this stock recently break out and will let the holding ride. no plans to make any changes till another entry pattern develops.
- all these names in the table above finished positive for the days. other names made highs but finished negative. those were JPM WDR PNC UNF BDC MELI GILD VRTS EXP TYL FEIC.
other setups to watch in todays 52wk highs list
- CVI – breaking out on high volume through a resistance level of 65. i added 1/4 pos today. fresh off of a weekly MACD xUP last week.
- OCN – continuing to move higher after breaking out of a long consolidation on may-10. weekly MACD xUP at breakout. 42.2 was the level i was watching. today closed at 44.31. i bought additional 1/4 a few days after and will maintain neutral for now. still not too late for entry.
- VAL likely to continue to make new new highs after weekly MACD xUP during the week before last. still time for entry this week.
2 notable 52wk HIGHS [EOD20130520] $TM $COG
Posted in 52 week highs on 2013/05/20
screen results:
- stubby’s screen results @ finviz.com.
- stubby’s screen criteria is based on technical & fundamental parameters.
rank results:


NOTE: stubby is long $TM. no position in $COG
top 5 stubbystock gainers for [EOD20130517] $CVI $KUB $SAIA $CBS $FEIC
Posted in Top 5 Daily Gainers on 2013/05/17

Economic Report Alert: Payrolls Up in 30 U.S. States in April, Led by Texas via @BloombergNews
Posted in Economic Reports on 2013/05/17
- Payrolls Increased in 30 U.S. States in April, Led by Texas
- http://bloom.bg/12gF47h
- via @BloombergNews

Economic Report Alert: Leading Indicators Up More Than Expected via @Street_Insider @BloombergNews
Posted in Economic Reports on 2013/05/17
- April Leading Indicators Rise 0.6% vs 0.2% Expected
- via @Street_Insider
- Leading Indicators Index in U.S. Rises More Than Forecast
- http://bloom.bg/12gDQbZ
- via @BloombergNews

Economic Report Alert: U.S. Consumer Confidence Up via @Street_Insider @BloombergNews
Posted in Economic Reports on 2013/05/17
- May (P) U.of M Confidence 83.7 vs 77.9 Expected
- via @Street_Insider
- Consumer Sentiment Index in U.S. Rose to 83.7 in May
- http://bloom.bg/12AfUlB
- via @BloombergNews

stubbystock technical alert: morning new highs list $KUB $CVI $SAIA $CBS $VRTS $TRIP $C $TM and more
Posted in 52 week highs on 2013/05/17
FINVIZ Stock Screener – Custom KUB,CVI,SAIA,CBS,VRTS,TRIP,C,TM,BDC,JPM,WDR,AXP,FEIC,TARO,PNC,MDSO,TYL perfytd
$KUB – daily performance leader of the pack

2 notable 52wk HIGHS [EOD20130516] $VRTS $TYL both ATHs
Posted in 52 week highs, ATH on 2013/05/16
screen results:
- stubby’s screen results @ finviz.com.
- stubby’s screen criteria is based on technical & fundamental parameters.
- all time highs: $VRTS $TYL
rank results: (csv format)
Rank no.,Symbol,Company Name,Composite Rating,EPS Rating,RS Rating,SMR Rating,Acc/Dis Rating,Group Rel Str Rating,ATH
1,VRTS,Virtus Investment Ptnrs,99,80,99,A,A,A,Y
2,TYL,Tyler Technologies Inc,96,90,93,A,A,C-,Y
charts:


Economic Report Summary 20160516: CPI,HOUSING STARTS,JOBLESS CLAIMS,PHILLY FED SURVEY
Posted in Economic Reports on 2013/05/16
CPI
- Bloomberg article: Consumer Prices in U.S. Dropped More Than Forecast in April http://bloom.bg/12xoTUE via @BloombergNews
- Econoday Economic Report: Consumer Price Index May 16, 2013

Released On 5/16/2013 8:30:00 AM For Apr, 2013
Prior Consensus Consensus Range Actual CPI – M/M change -0.2 % -0.3 % -0.4 % to 0.1 % -0.4 % CPI – Y/Y change 1.5 % 1.1 % CPI less food & energy 0.1 % 0.2 % -0.1 % to 0.2 % 0.1 % CPI less food & energy – Y/Y change 1.9 % 1.7 %
Housing Starts
- Bloomberg article: Housing Starts in U.S. Fell in April to Five-Month Low http://bloom.bg/12xp3vp via @BloombergNews
- Econoday Economic Report: Housing Starts May 16, 2013

Released On 5/16/2013 8:30:00 AM For Apr, 2013Prior Prior Revised Consensus Consensus Range Actual Starts – Level – SAAR 1.036 M 1.021 M 0.969 M 0.930 M to 1.000 M 0.853 M Permits – Level – SAAR 0.902 M 0.890 M 0.945 M 0.916 M to 0.980 M 1.017 M
Jobless Claims
- Bloomberg article: Jobless Claims in U.S. Jump to Highest Level in Six Weeks http://bloom.bg/12xoUbe via @BloombergNews
- Econoday Economic Report: Jobless Claims May 16, 2013

Released On 5/16/2013 8:30:00 AM For wk5/11, 2013Prior Prior Revised Consensus Consensus Range Actual New Claims – Level 323 K 328 K 330 K 329 K to 341 K 360 K 4-week Moving Average – Level 336.75 K 338.00 K 339.25 K New Claims – Change -4 K 1 K 32 K
Philadelphia Fed Survey
- Bloomberg article: Manufacturing in Philadelphia Fed Area Unexpectedly Contracts http://bloom.bg/12xEC69 via @BloombergNews
- Econoday Economic Report: Philadelphia Fed Survey May 16, 2013

Released On 5/16/2013 10:00:00 AM For May, 2013
Prior Consensus Consensus Range Actual General Business Conditions Index – Level 1.3 2.2 -3.0 to 6.6 -5.2
stubbystock technical alert: breakouts continue $OCN $JJSF $GMCR $CAB FEIC and more
Posted in Technical Alerts on 2013/05/16
breaking out: OCN JJSF GMCR VRTS FEIC ULTI ARMH GS WDR CBS
finviz charts: http://bit.ly/106Z0eT
Meet Stubby
my name is michael james. my aim is to articulate my wall street trading thesis and methodology as an individual trader. all trading i do is in my own SEP-IRA account. all content i post is for information & opinion purposes only and not intended to be investment advice.
STUBBY RSS FEED


16 stubbystock new 52wk HIGHS [EOD20130516]: $CAB $TRIP $VRTS $GMCR $OCN $WDR $ARMH & more including ATHs
Posted in 52 week highs, ATH, Commentary on 2013/05/16
notes:
ranking by IBD SmartSelect rating, EPS rating, RSI rating in that order. (listing in csv format)
Rank No.,Symbol,Company Name,Composite Rating ,EPS Rating,RS Rating,SMR Rating,Acc/Dis Rating,Group Rel Str Rating,ATH
1,GMCR,Green Mtn Coffee Roastrs,99,99,99,A,A+,A+,NO
2,TRIP,TripAdvisor Inc,99,97,93,A,B+,B-,YES
3,VRTS,Virtus Investment Ptnrs,99,80,99,A,A,A,YES
4,CAB,Cabelas Inc,99,96,95,B,B,A,YES
5,OCN,Ocwen Financial Corp,98,98,96,A,A+,C-,YES
6,ARMH,A R M Holdings Plc Ads,97,96,94,A,C,B,YES
7,WDR,Waddell & Reed Finl Cl A,97,89,89,A,C+,A,YES
8,BDC,Belden Inc,96,83,89,B,B+,B-,NO
9,ULTI,Ultimate Software Group,96,97,83,A,B,B,YES
10,TYL,Tyler Technologies Inc,96,90,93,A,A,C-,YES
11,N,Netsuite Inc,95,74,96,B,A-,B,YES
12,JJSF,J & J Snack Foods Corp,88,95,84,B,A-,C+,YES
13,FEIC,F E I Co,84,87,83,B,B+,D+,YES
14,JPM,J P Morgan Chase & Co,80,95,78,C,C,C,NO
15,PNC,P N C Financial Svcs Grp,74,81,61,B,B+,C+, NO
16,ASML,A S M L Holding N.V. NY,72,51,82,B,B+,C+,YES
$GMCR – top stubbystock chart & commentary
ARMH, ASML, BDC, CAB, FEIC, GMCR, JJSF, jpm, N, OCN, PNC, TRIP, TYL, ULTI, VRTS, WDR
Leave a comment