Posts Tagged CPA
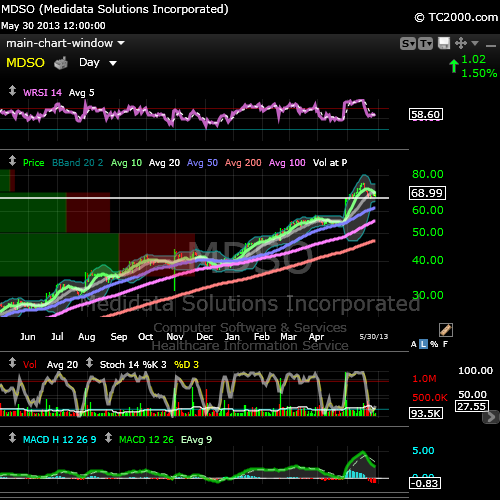
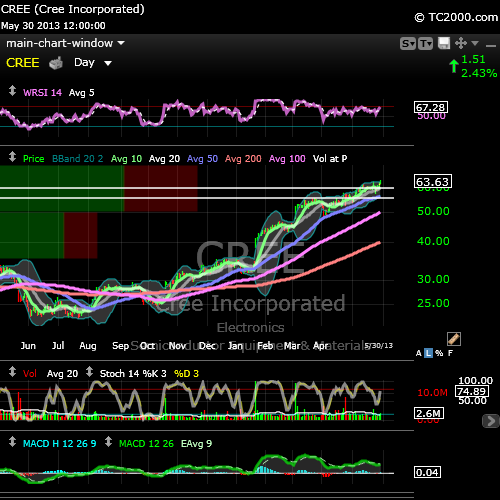
stubbystock portfolio review [EOD20130530] $MDSO $CPA $FLT $GILD $CREE top list by IBD rank
Posted by stubbybrown in Portfolio on 2013/05/30
symbols in alphabetical order: BBSI, BOFI, COG, COST, CPA, CREE, CSGP, DPZ, FLT, GILD, MDSO, MPC, SHOS, TYL ,UHS, UNF, VAL, WAB, WDC, WDR
finviz charts: in alphabetical order
stubbyrank criteria using IBD SmartSelect data:
- IBD composite rating: 80 or up
- IBD rs rating: 80 or up
- IBD eps rating: 70 or up
- equities are sorted in excel by 1, 2, 3 from above in that order. shifts ranking toward momentum rather than fundamental selection.
- typically i like to hold stocks with <5% float short. BOFI CREE DPZ are <10%.
stubbyallocation rules for constructing a diversified portfolio: (brief summary)
- i pick a benchmark that fits my thesis for at least a quarter going forward. then i use stubbyselect screens to look for additions to balance the portfolio as close as reasonably possible to the benchmark. currently, i am allocated to small/mid cap growth. the allocation is a close mix between ishares russell 2000 growth index etf IWO & ishares midcap growth index etf IWP.
- in addition to stubbyselect screening, i target long setups whose prices are reasonably close to each other and buy positions of shares in fractions based on a target total capital outlay. if i target $20K – $24K, positions may start in 1/4 or 1/8 positions. when i buy a long position, the cost of buying and selling the position ought not be more than 1/4 to 1/2% of that positions cost. i can achieve this using Interactive Brokers as my stock broker.
- to start with i equally share weight all purchases. years of backtesting have demonstrated my portfolios generally outperforms the benchmark by a handy margin over the course of several ups & downs over a year period of time. as the market moves, i’ll add or subtract positions based on technical buy or sell indicators. sometimes this results in being out of balance with my benchmark for some short periods of time.
- positions will be sold when they approach 1-3% loss when market technicals are very shaky. during strong uptrend markets i might let losses approach 5-8% if the stock is a leader and i feel there’s a good change of technicals turning in favor of the stock. positions with gains in the 15-30% range will be reduced or sold entirely.
- i take great advantage of worden tc2000 (the same people who produce freestockcharts.com) as my TA app and i set alarms based on price, volume and a whole host of technical indicators like cross ups or cross down in MACD, RSI, STOCHASTICS, CCI etc. worden does not integrate with my broker but i can manually setup automatic stop/loss trades based on my TA in tc2000 if i wish. i’m not a day trader which allows me more flexibility. for example, every now and then you may hear about mini or micro stock market crashes. prices suddenly drop 10% or more and then recover in 5 – 10 mins. an automatic stop/loss could lose a trader lots of money. this is a good segway to my next rule.
- i always keep large amounts of cash handy. i occasionally buy bond etfs and only under certain circumstances will i purchase inverse, levered inverse etfs or volatility tracking etfs. however i have lots of experience with inverse levered etfs and understand their weaknesses and advantages. prior to the 2008-2009 market collapse i developed a delta neutral arbitrage algorithm based on long/short etfs for a particular index which resulted in producing an oscillator to measure bullish or bearish market trends. i found the algo to be no more reliable than conventional oscillators as market conditions substantially improved. i do not trade options.
- i will bend these rules only when i think there is a high probability of obtaining exceptional short-term gains or to maneuver away from outsized losses.
in another post i’ll talk about my info gathering routines to look for catalysts for stock i hold or am watching, news to stay on top of market sentiment and i follow the domestic & global bond market like a hawk, currency indexes, precious metals futures and commodities sometimes. these can be proxy indicators for future supply and demand effecting the economy and the consumer in particular. another topic i will is how i use analytics in the morningstar.com personal portfolio manager and sites i rely on during earnings season.
current asset allocation: provided by morningstar.com personal portfolio manager.

worden charts of top 5:


6 notable 52wk HIGHS [EOD20130423] $CPA $ECL $TUP $SHW $WHR $PG
Posted by stubbybrown in 52 week highs on 2013/04/23
6 Notable 52wk HIGHS screened & ranked using Finviz & IBD respectively
ticker symbols:
- $CPA $ECL $TUP $SHW $PG $WHR in order of rank. see below for more details.
- these charts & quotes above are provided by finviz.com.
screening method:
- screen from all 6400+ stocks listed at finfiz.com
- must close above previous 52 wk high
- positive institutional transactions
- short float <5%
- gap up
- performance1 today up
- performance2 YTD +10%
- above 20dma
- above 50dma
- above 200dma
- 52wk high
- relative volume over 100%
- price over $50
rank criteria using IBD SmartSelect:
- composite rating 80 or greater
- eps rating rating 70 or greater
- rs rating rating 80 or greater
ranking results: (csv format)
No.,Symbol,Company Name,Composite Rating,EPS Rating,RS Rating,YTD perf
1,CPA,Copa Holdings Sa,99,83,91,23.87%
2,ECL,Ecolab Inc,97,91,81,16.89%
3,TUP,Tupperware Brands Corp,96,91,92,31.40%
4,SHW,Sherwin-Williams Co,89,86,86,18.33%
5,PG,Procter & Gamble,88,70,81,22.57%
6,WHR,Whirlpool Corp,88,79,95,20.45%
top ranked chart: $CPA
 –
–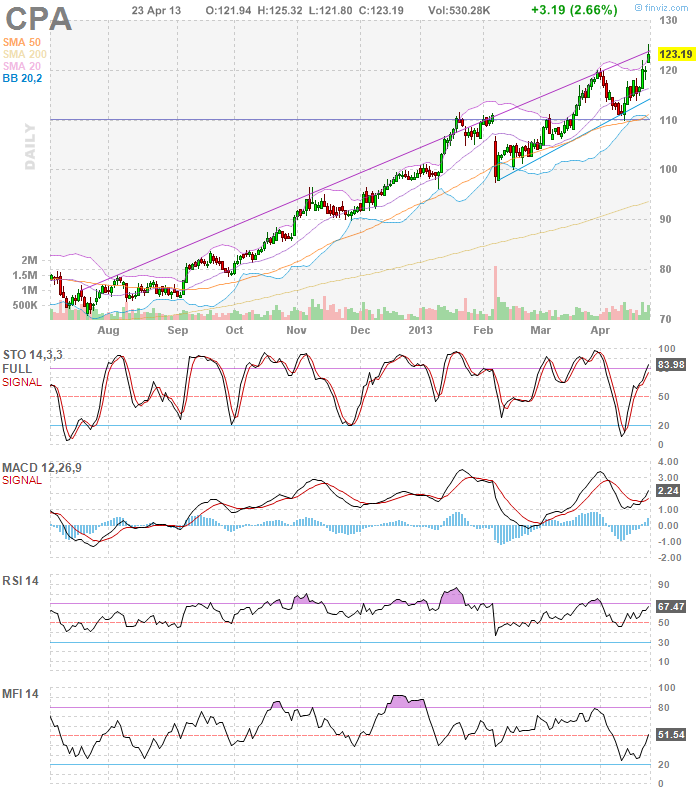
stubby’s chart commentary on today’s top rank chart:
- today CPA broke through horizontal resistance @ 120, gapping up on greater than average vol and closed @ 123.19, above it’s previous 52wk high by 0.83%.
- all indicators i watch are rising STOCHASTICS, MACD, RSI(14), MONEY FLOW INDEX, ACCUMULATION, CCI(20).
- the candle formation is characteristic of a shooting star (bearish). however all the other signals overwhelmingly mitigate 1 possible blemish.
- the finviz chart (to the right above) shows CPA in a upward channel trend line with the price at the very top line. because the stock broke out over the horizontal resistance line with a lot of momentum, it would be reasonable to expect the momentum to continue breaking higher above the trend line. in addition to note, previous encounters with the upper trend line were at extremely overbought RSI levels which isn’t the case yet. RSI is 67.46 and anything > 70 is considered hot & overbought but high momentum stocks are known to run up into the high 8o’s before retreating. so we’ll see.
- i am already long CPA 1-1/4 position cost @ 113.2. therefore i intend to remain neutral in this overweight position. my next buy point to consider would likely be when the 100 DMA or 50DMA catches up with the stock price, depending on market sentiment at the time.
upcoming earnings & new analyst ratings:
- AnalystWire Apr. 23 at 7:56 AM JPMorgan Upgrades / Assumes Copa Holdings ($CPA) to Overweight http://stks.co/hSdJ
- CPA earnings are due to be reported on or about may-9-2013.
- CPA – Company Description: PANAMANIAN AIRLINE THAT PROVIDES PASSENGER AND CARGO SERVICES TO 59 DESTINATIONS IN THE AMERICAS AND THE CARIBBEAN.Read More At Investor’s Business Daily: http://research.investors.com/quotes/nyse-copa-holdings-sa-cpa.aspx#ixzz2QxPoJurW Follow us: @IBDinvestors on Twitter | InvestorsBusinessDaily on Facebook
- i am NOT affiliated with finviz.com, investors.com or stocktwits.com. i am a completely independent individual trader.
disclosure(s):
stubbystock 52wk highs $CPA $DIS $GILD $HD $HSY $SAM
Posted by stubbybrown in 52 week highs on 2013/04/19
finviz stock quotes & charts – http://bit.ly/11pqoT8
i am long all stubbystock™ mentions.
2 Notable 52wk HIGHS [EOD20130419] $CPA $PG
Posted by stubbybrown in 52 week highs on 2013/04/19
2 Notable 52wk HIGHS i screened for & ranked using Finviz & IBD respectively
ticker symbols:
- $CPA $PG in order of rank. see below for more details.
- these charts & quotes above are provided by finviz.com.
screening method:
- screen from all 6400+ stocks listed at finfiz.com
- must close above previous 52 wk high
- positive institutional transactions
- short float <5%
- gap up
- performance1 today up
- performance2 YTD +10%
- above 20dma
- above 50dma
- above 200dma
- 52wk high
- relative volume over 100%
- price over $50
rank criteria using IBD SmartSelect:
- composite rating 80 or greater
- eps rating rating 70 or greater
- rs rating rating 80 or greater
results: (csv format)
No.,Symbol,Company Name,Composite Rating,EPS Rating,RS Rating
1,CPA,Copa Holdings Sa,99,83,90
2,PG,Procter & Gamble,86,71,81
 –
–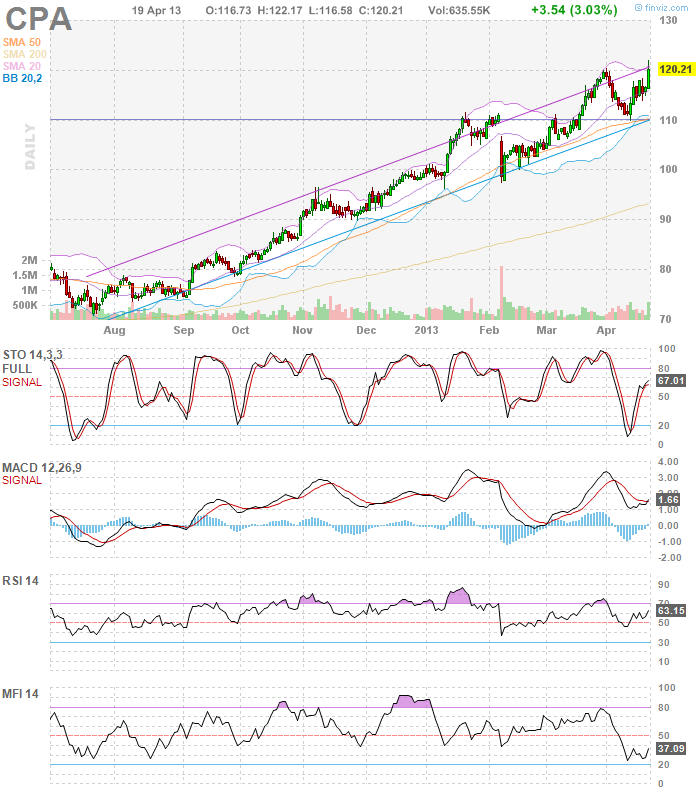
stubby’s chart commentary on today’s top rank chart:
- looking at the primary measures i watch, CPA is on an upswing and looks well positioned to breakout higher above the current close $120.21. today the stock climbed 3.03% setting a new ATH on volume 70% higher than average. MACD xUP signal is positive, RSI is starting to turn higher at a comfortable level of 52.38. not shown , MFI index is turning higher as with the WILLIAM’S A/D & CCI 20day indicators.
- before a breakout is confirmed, look for follow thru in upward price momentum on higher than average volume. i am already long this stock a full position. if it breaks out, i may add another 1/4 long position
- CPA earnings are due to be reported on or about may-9-2013.
- CPA – Company Description: PANAMANIAN AIRLINE THAT PROVIDES PASSENGER AND CARGO SERVICES TO 59 DESTINATIONS IN THE AMERICAS AND THE CARIBBEAN.Read More At Investor’s Business Daily: http://research.investors.com/quotes/nyse-copa-holdings-sa-cpa.aspx#ixzz2QxPoJurW Follow us: @IBDinvestors on Twitter | InvestorsBusinessDaily on Facebook
- i am NOT affiliated with finviz.com, investors.com or stocktwits.com. i am a completely independent individual trader.
disclosure(s):
- I am long full positions in CPA.
stubbystock technical alert RSI xUP [EOD20130416] $AMGN $ASR $BRKB $CELG $CPA $DIS $GILD $HSY $SJM $TRIP $TWX $VIAB
Posted by stubbybrown in Technical Alerts on 2013/04/16
AMGN, ASR, BRKB, CELG, CPA, DIS, GILD, HSY, SJM, TRIP, TWX, VIAB – finviz charts & quotes http://bit.ly/13ilkkz
i am long these listed.

previous 52wk high posts on SeekingAlpha
Posted by stubbybrown in 52 week highs on 2013/03/27
note: finviz chart links on SA post
8 Notable 52wk HIGHS By Desc % Price Delta [EOD20130326] – stubbybrown – Seeking Alpha
3 Notable 52wk HIGHS By Desc % Price Delta [EOD20130325] – stubbybrown – Seeking Alpha
- SA blog post http://bit.ly/10fdWmB
- symbols (quotes via SA) $KUB $MMP $OII
7 Notable 52wk HIGHS By Desc % Price Delta [EOD20130322] – stubbybrown – Seeking Alpha
9 Notable 52WK HIGHS – 20130320 – stubbybrown – Seeking Alpha
7 Notable 52WK HIGHS – 20130319 – stubbybrown – Seeking Alpha
Meet Stubby
my name is michael james. my aim is to articulate my wall street trading thesis and methodology as an individual trader. all trading i do is in my own SEP-IRA account. all content i post is for information & opinion purposes only and not intended to be investment advice.
STUBBY RSS FEED

