Archive for April, 2013
5 notable 52wk highs [EOD20130429] $OII $TARO $BEAV $NKE $RE
Posted by stubbybrown in 52 week highs on 2013/04/30


stubbystock technical alert summary [EOD20130429] $VRX $GMCR $SRE $HES and others
Posted by stubbybrown in Technical Alerts on 2013/04/29
NOTE: stubbystocks are equities or etfs i hold as of this post. quotes via StockTwits.com
- RSI xUP 5DMA #bullish #signal $VRX $COO $JBHT $SRE $IFF
- 10DMA xUP 20DMA #bullish #signal $GMCR $CP $IYF $UNF
- STOC xUP #bullish #signal $IYK $SRE $CHD
- MACD xUP #bullish #signal $HES
- daily price xUP 10DMA #bullish #signal $CSGP $VRX $GMCR
EDUCATIONAL RESOURCES:
stubby’s notable 52wk high stubbyscreen criteria
Posted by stubbybrown in 52 week highs, StubbySelect Screens on 2013/04/29
REVISIONS: may-1-2013: included in my finviz screen, the “change from open” parameter is now set to UP and no longer the screen default of ANY.
NOTE: this screen is for educational purposes only and can be replicated as is with no guarantee or warrantee of any results if used. you will need an IBD account to rank them accordingly.
stubby’s screening method: (the actual instance of the Finviz screen i run at EOD.)
- screen from all 6400+ stocks listed at finfiz.com
- must close above previous 52 wk high
- positive institutional transactions
- short float <5%
- gap up
- performance1 today up
- performance2 YTD +10%
- above 20dma
- above 50dma
- above 200dma
- 52wk high
- relative volume over 100%
- price over $50
- change form open is up (added may-1-2013)
stubby’s ranking criteria using IBD SmartSelect: (you’ll need an IBD account to see all rank criteria.)
- composite rating 80 or greater
- eps rating rating 70 or greater
- rs rating rating 80 or greater
Economic Reports this week: Durable Goods Orders, Jobless Claims, GDP #sequestration
Posted by stubbybrown in Economic Reports on 2013/04/23
wednesday, apr-24-2013
- Durable Goods Orders to be Released On 4/24/2013 8:30:00 AM For Mar, 2013
- New Orders – M/M change: Prior 5.7 % – Consensus (2.8 %) – Consensus Range (6.0 %) to 0.3 %


thursday, apr-25-2013
- Jobless Claims to be Released On 4/25/2013 8:30:00 AM For wk4/20, 2013
- New Claims – Level: Prior 352 K – Consensus 350 K – Consensus Range 340 K to 360 K


friday, apr-26, 2013
- GDP to be Released On 4/26/2013 8:30:00 AM For Q1:13
- Real GDP – Q/Q change – SAAR: Prior 0.4 % – Consensus 3.1 % – Consensus Range 2.3 % to 3.3 %
- GDP price index – Q/Q change – SAAR: Prior 1.0 % – Consensus 1.4 % – Consensus Range 0.9 % to 1.8 %


6 notable 52wk HIGHS [EOD20130423] $CPA $ECL $TUP $SHW $WHR $PG
Posted by stubbybrown in 52 week highs on 2013/04/23
6 Notable 52wk HIGHS screened & ranked using Finviz & IBD respectively
ticker symbols:
- $CPA $ECL $TUP $SHW $PG $WHR in order of rank. see below for more details.
- these charts & quotes above are provided by finviz.com.
screening method:
- screen from all 6400+ stocks listed at finfiz.com
- must close above previous 52 wk high
- positive institutional transactions
- short float <5%
- gap up
- performance1 today up
- performance2 YTD +10%
- above 20dma
- above 50dma
- above 200dma
- 52wk high
- relative volume over 100%
- price over $50
rank criteria using IBD SmartSelect:
- composite rating 80 or greater
- eps rating rating 70 or greater
- rs rating rating 80 or greater
ranking results: (csv format)
No.,Symbol,Company Name,Composite Rating,EPS Rating,RS Rating,YTD perf
1,CPA,Copa Holdings Sa,99,83,91,23.87%
2,ECL,Ecolab Inc,97,91,81,16.89%
3,TUP,Tupperware Brands Corp,96,91,92,31.40%
4,SHW,Sherwin-Williams Co,89,86,86,18.33%
5,PG,Procter & Gamble,88,70,81,22.57%
6,WHR,Whirlpool Corp,88,79,95,20.45%
top ranked chart: $CPA
 –
–
stubby’s chart commentary on today’s top rank chart:
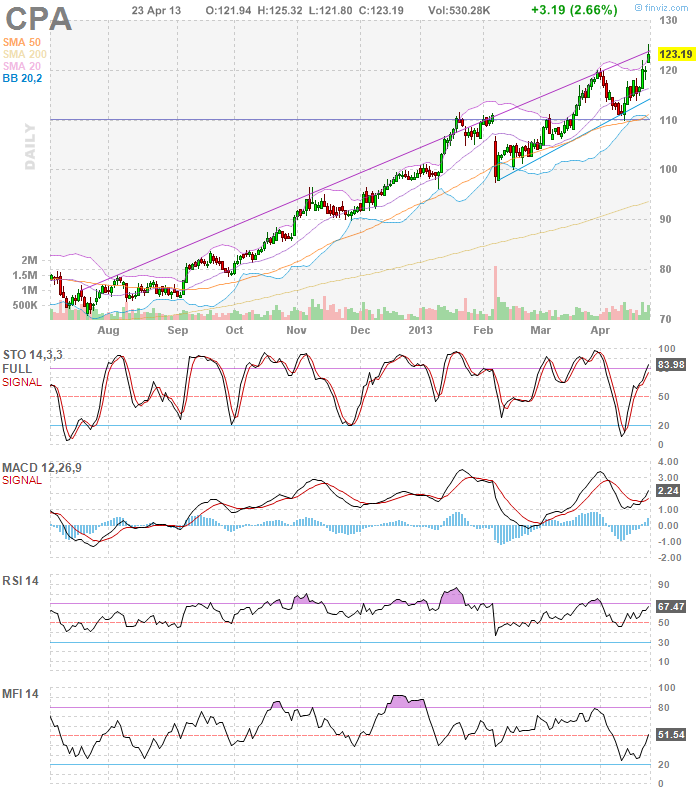
- today CPA broke through horizontal resistance @ 120, gapping up on greater than average vol and closed @ 123.19, above it’s previous 52wk high by 0.83%.
- all indicators i watch are rising STOCHASTICS, MACD, RSI(14), MONEY FLOW INDEX, ACCUMULATION, CCI(20).
- the candle formation is characteristic of a shooting star (bearish). however all the other signals overwhelmingly mitigate 1 possible blemish.
- the finviz chart (to the right above) shows CPA in a upward channel trend line with the price at the very top line. because the stock broke out over the horizontal resistance line with a lot of momentum, it would be reasonable to expect the momentum to continue breaking higher above the trend line. in addition to note, previous encounters with the upper trend line were at extremely overbought RSI levels which isn’t the case yet. RSI is 67.46 and anything > 70 is considered hot & overbought but high momentum stocks are known to run up into the high 8o’s before retreating. so we’ll see.
- i am already long CPA 1-1/4 position cost @ 113.2. therefore i intend to remain neutral in this overweight position. my next buy point to consider would likely be when the 100 DMA or 50DMA catches up with the stock price, depending on market sentiment at the time.
upcoming earnings & new analyst ratings:
- AnalystWire Apr. 23 at 7:56 AM JPMorgan Upgrades / Assumes Copa Holdings ($CPA) to Overweight http://stks.co/hSdJ
- CPA earnings are due to be reported on or about may-9-2013.
- CPA – Company Description: PANAMANIAN AIRLINE THAT PROVIDES PASSENGER AND CARGO SERVICES TO 59 DESTINATIONS IN THE AMERICAS AND THE CARIBBEAN.Read More At Investor’s Business Daily: http://research.investors.com/quotes/nyse-copa-holdings-sa-cpa.aspx#ixzz2QxPoJurW Follow us: @IBDinvestors on Twitter | InvestorsBusinessDaily on Facebook
- i am NOT affiliated with finviz.com, investors.com or stocktwits.com. i am a completely independent individual trader.
disclosure(s):
RSI xUP setups stubby likes (no pos) $AEP $GIS $IFF $PNW $SAFM $SNI
Posted by stubbybrown in Technical Alerts on 2013/04/22
finviz charts http://bit.ly/17KSF8A
STOC xUP setups stubby likes (no pos) $BDX $BEAV $DPZ $ENR $FISV $IFF $LLY $PNW $RKT
Posted by stubbybrown in Technical Alerts on 2013/04/22
finviz charts http://bit.ly/12D0DB8
11 stubbystock 52wk highs $BIIB $CELG $AMGN $GILD $ECL $TWX $DIS $VIAB $ABC $SAM $BOND
Posted by stubbybrown in 52 week highs on 2013/04/22
finviz charts http://bit.ly/ZheL2c
top 5 stubbystock daily gainers for 2013-04-22 $BIIB $CELG $TGI $FLT $AMGN
Posted by stubbybrown in Top 5 Daily Gainers on 2013/04/22
- finviz.com charts http://bit.ly/15BP8wz
- BIIB CELG AMGN closed at new 52wk highs
stubbystock 52wk highs $CPA $DIS $GILD $HD $HSY $SAM
Posted by stubbybrown in 52 week highs on 2013/04/19
finviz stock quotes & charts – http://bit.ly/11pqoT8
i am long all stubbystock™ mentions.
2 Notable 52wk HIGHS [EOD20130419] $CPA $PG
Posted by stubbybrown in 52 week highs on 2013/04/19
2 Notable 52wk HIGHS i screened for & ranked using Finviz & IBD respectively
ticker symbols:
- $CPA $PG in order of rank. see below for more details.
- these charts & quotes above are provided by finviz.com.
screening method:
- screen from all 6400+ stocks listed at finfiz.com
- must close above previous 52 wk high
- positive institutional transactions
- short float <5%
- gap up
- performance1 today up
- performance2 YTD +10%
- above 20dma
- above 50dma
- above 200dma
- 52wk high
- relative volume over 100%
- price over $50
rank criteria using IBD SmartSelect:
- composite rating 80 or greater
- eps rating rating 70 or greater
- rs rating rating 80 or greater
results: (csv format)
No.,Symbol,Company Name,Composite Rating,EPS Rating,RS Rating
1,CPA,Copa Holdings Sa,99,83,90
2,PG,Procter & Gamble,86,71,81
 –
–
stubby’s chart commentary on today’s top rank chart:
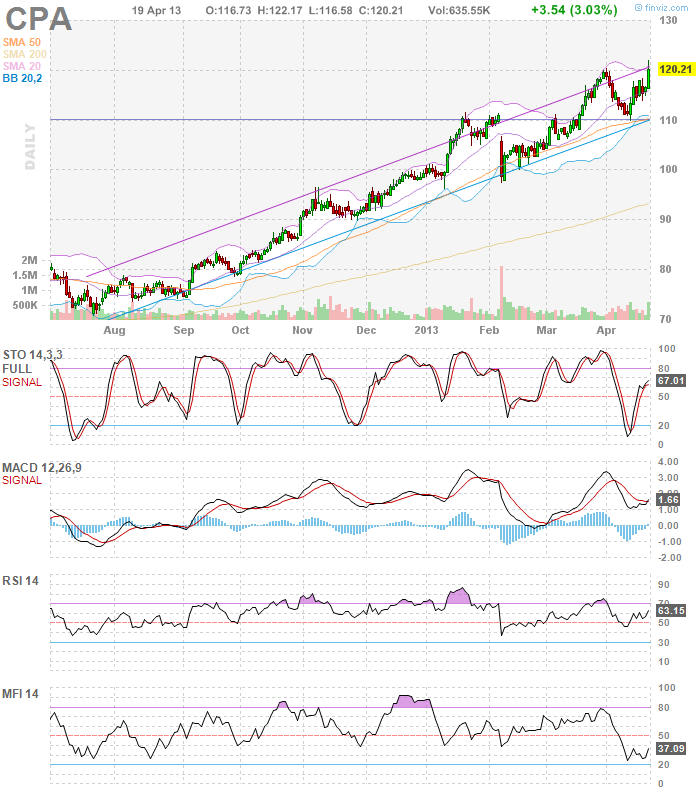
- looking at the primary measures i watch, CPA is on an upswing and looks well positioned to breakout higher above the current close $120.21. today the stock climbed 3.03% setting a new ATH on volume 70% higher than average. MACD xUP signal is positive, RSI is starting to turn higher at a comfortable level of 52.38. not shown , MFI index is turning higher as with the WILLIAM’S A/D & CCI 20day indicators.
- before a breakout is confirmed, look for follow thru in upward price momentum on higher than average volume. i am already long this stock a full position. if it breaks out, i may add another 1/4 long position
- CPA earnings are due to be reported on or about may-9-2013.
- CPA – Company Description: PANAMANIAN AIRLINE THAT PROVIDES PASSENGER AND CARGO SERVICES TO 59 DESTINATIONS IN THE AMERICAS AND THE CARIBBEAN.Read More At Investor’s Business Daily: http://research.investors.com/quotes/nyse-copa-holdings-sa-cpa.aspx#ixzz2QxPoJurW Follow us: @IBDinvestors on Twitter | InvestorsBusinessDaily on Facebook
- i am NOT affiliated with finviz.com, investors.com or stocktwits.com. i am a completely independent individual trader.
disclosure(s):
- I am long full positions in CPA.
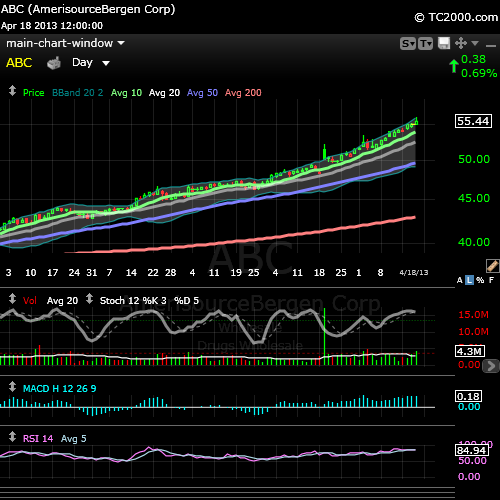
stubbystock 52wk high $ABC closed on above ave vol #neutral
Posted by stubbybrown in 52 week highs on 2013/04/18
Amerisourcebergen Corp $ABC, Company Description: DISTRIBUTES BRAND NAME AND GENERIC DRUGS, OVER-THE-COUNTER HEALTHCARE PRODUCTS AND HOME HEALTHCARE SUPPLIES
~
Symbol,Company Name,IBD Composite Rating,IBD EPS Rating,IBD RS Rating
ABC,Amerisourcebergen Corp,92,92,92
~
Read More At Investor’s Business Daily: http://research.investors.com/quotes/nyse-amerisourcebergen-corp-abc.aspx#ixzz2Qs3Cc7Ee Follow us: @IBDinvestors on Twitter | InvestorsBusinessDaily on Facebook
~
stubbystock technical alert 20WMA xDOWN bearish signal $FLS
Posted by stubbybrown in Technical Alerts on 2013/04/18
as you can see, flowserve $FLS has been on quite a run since lows in oct-2011 during the height of the european central bank charter formation and post S&P downgrade of u.s. sovereign debt. it’s never possible to tell how far markets can drop in the current sell-off. as a position trader, my downside limit for $FLS is the 50WMA. at the moment, selling is mild on light volume. if the $FLS does NOT bounce and begin forming a base, i will start peiling off 1/4 positions at a time. my thesis is the S&P500 is due for a 10% sell off from it’s recent highs. that’s another indicator i’ll be looking for as a basis to determine whether to sell positions. so far, i have sold no positions in $FLS.

stubbystock technical alert MACD xDOWN weekly signal $ENB $MANH $MWIV
Posted by stubbybrown in Technical Alerts on 2013/04/17


-
You are currently browsing the archives for April, 2013
Meet Stubby
my name is michael james. my aim is to articulate my wall street trading thesis and methodology as an individual trader. all trading i do is in my own SEP-IRA account. all content i post is for information & opinion purposes only and not intended to be investment advice.
STUBBY RSS FEED


a short-term bearish equity market outlook $SPX $DIA $QQQ
Posted by stubbybrown in Commentary, Technical Alerts on 2013/04/27
during the remainder of this quarter, equity markets are likely to be under some selling pressure. this thesis is based on the historical pattern of rising and falling US 30yr T-bond yields which influence equity market sentiment changes from risk-on and risk-off. however longer-term, my outlook toward equities is constructive. the charts i’ve included help illustrate my thesis.
CHART #1 – making the case that longer-term uptrend market sentiment in equities is still intact
CHART #2 – making the case for short-term equity bearishness and jitters.
CONCLUSION: i have not begun to short the broader equity market. in the passed there have been a couple of ways i achieved that. (1) through purchasing inverse and inverse leveraged market index etfs OR through purchase of volatility etns. (2) if i don’t short the market but still want some protection, i’ll raise cash ahead of a perceived slow down by taking profits off the table and purchasing various bond related etfs whether treasuries or corp investible bond etfs. recently i’ve taken a higher position in bonds than normal for me in the following bond related etfs: $BOND $LQD $LTPZ $PDI $TLT. they comprise 20% of invested holdings vs 80% equities. and about 22% of my grand total account holdings is cash. let’s see what the future holds over the next 4 – 16 weeks.
BEARISH EQUITIES, DIA, QQQ, SP500, SPX, TYX
Leave a comment