Archive for May, 2013
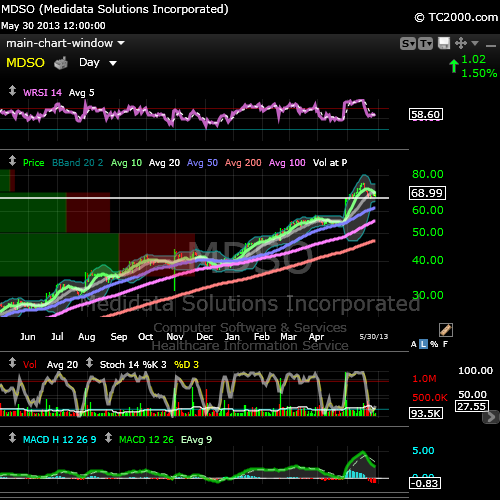
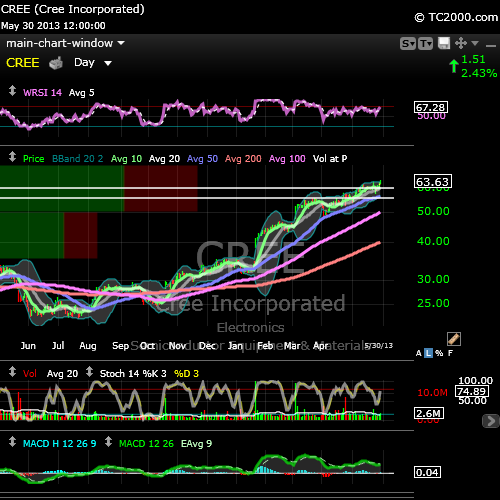
stubbystock portfolio review [EOD20130530] $MDSO $CPA $FLT $GILD $CREE top list by IBD rank
Posted by stubbybrown in Portfolio on 2013/05/30
symbols in alphabetical order: BBSI, BOFI, COG, COST, CPA, CREE, CSGP, DPZ, FLT, GILD, MDSO, MPC, SHOS, TYL ,UHS, UNF, VAL, WAB, WDC, WDR
finviz charts: in alphabetical order
stubbyrank criteria using IBD SmartSelect data:
- IBD composite rating: 80 or up
- IBD rs rating: 80 or up
- IBD eps rating: 70 or up
- equities are sorted in excel by 1, 2, 3 from above in that order. shifts ranking toward momentum rather than fundamental selection.
- typically i like to hold stocks with <5% float short. BOFI CREE DPZ are <10%.
stubbyallocation rules for constructing a diversified portfolio: (brief summary)
- i pick a benchmark that fits my thesis for at least a quarter going forward. then i use stubbyselect screens to look for additions to balance the portfolio as close as reasonably possible to the benchmark. currently, i am allocated to small/mid cap growth. the allocation is a close mix between ishares russell 2000 growth index etf IWO & ishares midcap growth index etf IWP.
- in addition to stubbyselect screening, i target long setups whose prices are reasonably close to each other and buy positions of shares in fractions based on a target total capital outlay. if i target $20K – $24K, positions may start in 1/4 or 1/8 positions. when i buy a long position, the cost of buying and selling the position ought not be more than 1/4 to 1/2% of that positions cost. i can achieve this using Interactive Brokers as my stock broker.
- to start with i equally share weight all purchases. years of backtesting have demonstrated my portfolios generally outperforms the benchmark by a handy margin over the course of several ups & downs over a year period of time. as the market moves, i’ll add or subtract positions based on technical buy or sell indicators. sometimes this results in being out of balance with my benchmark for some short periods of time.
- positions will be sold when they approach 1-3% loss when market technicals are very shaky. during strong uptrend markets i might let losses approach 5-8% if the stock is a leader and i feel there’s a good change of technicals turning in favor of the stock. positions with gains in the 15-30% range will be reduced or sold entirely.
- i take great advantage of worden tc2000 (the same people who produce freestockcharts.com) as my TA app and i set alarms based on price, volume and a whole host of technical indicators like cross ups or cross down in MACD, RSI, STOCHASTICS, CCI etc. worden does not integrate with my broker but i can manually setup automatic stop/loss trades based on my TA in tc2000 if i wish. i’m not a day trader which allows me more flexibility. for example, every now and then you may hear about mini or micro stock market crashes. prices suddenly drop 10% or more and then recover in 5 – 10 mins. an automatic stop/loss could lose a trader lots of money. this is a good segway to my next rule.
- i always keep large amounts of cash handy. i occasionally buy bond etfs and only under certain circumstances will i purchase inverse, levered inverse etfs or volatility tracking etfs. however i have lots of experience with inverse levered etfs and understand their weaknesses and advantages. prior to the 2008-2009 market collapse i developed a delta neutral arbitrage algorithm based on long/short etfs for a particular index which resulted in producing an oscillator to measure bullish or bearish market trends. i found the algo to be no more reliable than conventional oscillators as market conditions substantially improved. i do not trade options.
- i will bend these rules only when i think there is a high probability of obtaining exceptional short-term gains or to maneuver away from outsized losses.
in another post i’ll talk about my info gathering routines to look for catalysts for stock i hold or am watching, news to stay on top of market sentiment and i follow the domestic & global bond market like a hawk, currency indexes, precious metals futures and commodities sometimes. these can be proxy indicators for future supply and demand effecting the economy and the consumer in particular. another topic i will is how i use analytics in the morningstar.com personal portfolio manager and sites i rely on during earnings season.
current asset allocation: provided by morningstar.com personal portfolio manager.

worden charts of top 5:


9 stubbyselect mentions [EOD20130529] $CVI $BIIB $FLT $GILD $VRX and more
Posted by stubbybrown in StubbySelect Screens on 2013/05/29
symbols in alphabetical order: ACT, BIIB, COG, CVI, FLT, GILD, LIFE, VRX, WDC
disclosure: stubby is long FLT, GILD, WDC
finviz charts: in alphabetical order
stubbyselect criteria:
- population of equities scanned: IBD50, IBD BigCap 20, IBD NewAmerica, IBD 8585, IBD MainTable, ST50, BarChart Top100. date of lists as of 2013-05-27
- stock price > 50 daily
- percent shares held by institutions ranks between 75.00 and max (worden tc2000 specific)
- latest short interest ratio ranks between min and 75.00 (worden tc2000 specific)
- YTD % change > 40
- price history above 20DMA
- price history above 50DMA
- short float <5% (filtered @ finviz)
- IBD composite rating: 80 or up
- IBD rs rating: 80 or up
- IBD eps rating: 70 or up (results sorted in that order to obtain rank)
- NOTE: today’s stubbyselect screen was NOT the same as yesterday’s. today;s list of stocks is not focused around any particular technical signal or indicator. so today’s list is very general. in the future i will start categorizing stubbyselect criteria in more defined classifications.


results & ranking:
worden charts of top 5:


18 stubbyselect 10DMA xUPs [EOD20130528] $VRTS $AMG $FLT $PKG $BEAV and more
Posted by stubbybrown in Technical Alerts on 2013/05/28
symbols in alphabetical order: AE AMG AMP BEAV BLK CI DIS DISCK EVR FBHS FLT GEL LVS MANH PKG UHS VRTS WAB
disclosure: stubby is long UHS, WAB
charts: in alphabetical order @ finviz. NOTE: DISCK is not listed at finviz.
stubbyselect criteria:
- price crossing up 10DMA
- short float <5%
- IBD composite rating: 80 or up
- IBD rs rating: 80 or up
- IBD eps rating: 70 or up

the last remaining stubbystocks [EOD20130522] $ACT $DPZ $GILD $ICON $PAA $SAIA $TBT $TYL $UHS $UNF $VAL $WAB
Posted by stubbybrown in Portfolio on 2013/05/22
charts & quotes:
- finviz.com
- all equities ranked below in line with stubby’s IBD screen criteria. TBT is Proshrs Ultsht 20+ Yr etf.
No.1 rank chart and commentary:

- highest ranked: PAA
- today i unloaded a lot of holdings, some for profit and some for loss. DPZ, ICON may wind up going because their float short percentages are higher than i like respectively: 6.19%, 23.25%.
- ACT: hourly chart – exhibiting standing bear with claws up high. my way of saying bear flag. conceivably could drop to 120.
- DPZ: daily chart – looking decent. could make a run for it’s 50DMA now @ 52.98.
- GILD: daily chart – looking decent. could make a run for it’s 50DMA now @ 50.53.
- ICON: daily chart – exhibiting standing bear with claws up high. could make a run for it’s 50DMA now @ 26.82.
- PAA: daily chart – behaving pretty well. fairly tight MACD range. could make a run for it’s 200HRMA now @ 57.56.
- SAIA: daily chart – a little bear claw looking. conceivably could drop to 40.
- TYL: daily chart – a little bear claw looking. conceivably could drop to 63.
- UHS: daily chart – near decent looking support level between current price and 65.
- UNF: daily chart – near decent looking support level between current price and 94.10.
- VAL: daily chart – a little bear claw looking. conceivably could drop to 68.
- WAB: daily chart – actually looks in a bull flag formation. solid support starts kicking in @ 107.5.
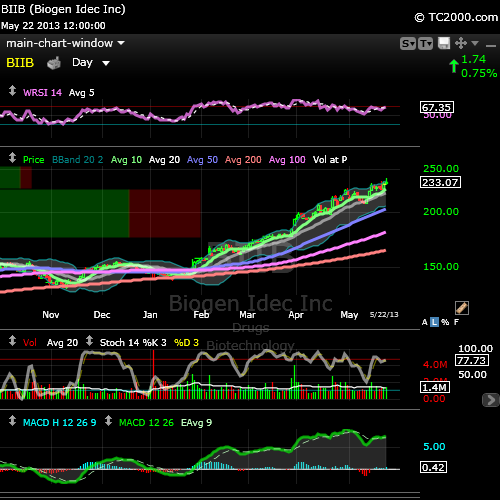
2 notable 52wk HIGHS [EOD20130522] $BIIB $JPM
Posted by stubbybrown in 52 week highs on 2013/05/22
charts & quotes
- finviz.com
- stubby’s notable screen criteria is based on technical & fundamental parameters.
ranked table of highs
No.1 rank chart and commentary
- based on my screening criteria, neither of these 2 stocks would have made the notables were it a normal day on wall street. BIIB & JPM did not close above the previous 52wk (or all time high if that is the case.) not much was normal on wall street today. more on that in another post.
- having said that, these 2 stocks did hold up rather well considering the extreme selling pressure on the market as a whole. a look at BIIB’s chart and what jumps out MA divergence is around 52 wk highs. this leaves BIIB somewhat vulnerable to additional selling pressure if investors and traders decide in the next few days it’s time to take profits. we’ll just have to wait and see.
- so i have no plans to get into BIIB at the moment. it might be wise to consider taking some profits before the street forces the trade. my status on BIIB would be SELL some if profits are high and hold otherwise. i’d like to see MACD come in and revert to mean some.

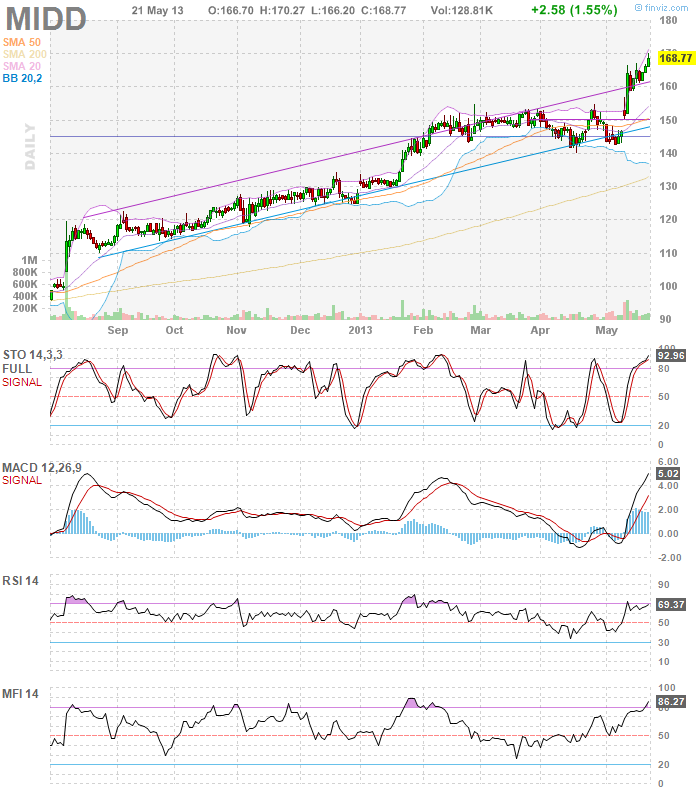
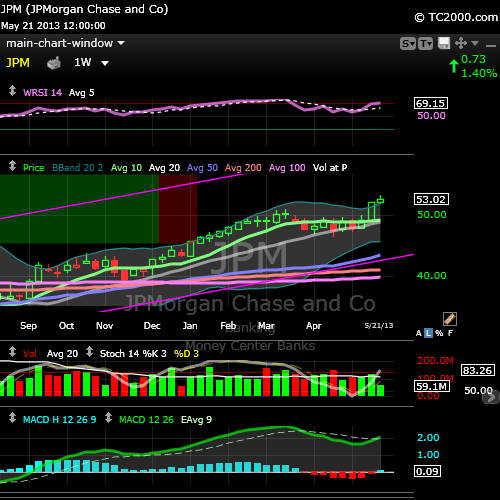
11 new stubbystock HIGHS [EOD20130521] $CVI $MIDD $JPM $PNC $SAIA $GS $AXP $ASML $TM $C $UNF
Posted by stubbybrown in 52 week highs on 2013/05/21
charts & quotes
ranked table of highs
- stubby’s rank criteria based on IBD SmartSelect parameters.
No.1 rank chart and commentary
- Company Profile: Middleby Corp (MIDD) Company Description: MANUFACTURES A BROAD LINE OF COOKING AND WARMING EQUIPMENT USED IN HOTELS, RESTAURANTS AND OTHER INSTITUTIONS.
- MIDD has been one of my fav industrial stocks this year. currently listed as no. 1 leader in it’s category on IBD. the daily & weekly chart show MIDD has recently broken out. in the weekly timeframe, this is the second week of gaining higher since since breaking out of the box. MIDD looks to continue it’s charge higher.
- my current status for MIDD is HOLD until the stock exhibits to test the upper trend-line drawn in the finviz daily chart OR another MACD xUP on the daily chart.

other setups to watch in todays 52wk highs list
- as mentioned yesterday, CVI – breaking out through a resistance level of 65. if it pulls back, watch for support @ 66.13 in which case would make a good entry if bounces higher on high vol.
- JMP – status HOLD. new hrly support level(s) @ 52.00 & 51.01.
- PNC – status HOLD. new hrly support level(s) @ 71.16 & 70.35.
- SAIA – status HOLD. new hrly support level(s) @47.36 & 46.95.
- GS – status HOLD. new hrly support level(s) @ 157.44
- AXP – status HOLD. new hrly support level(s) @ 74.20 & 73.00
- ASML – status HOLD. new hrly support level(s) @ 77.52
- TM – status HOLD. new hrly support level(s) @ 127.60 & 122.53
- C – status HOLD. new hrly support level(s) @ 51.00 & 49.05
- UNF – status HOLD. new hrly support level(s) @ 95.50 & 94.51
2 notable 52wk HIGHS [EOD20130521] $AHGP $JPM
Posted by stubbybrown in 52 week highs on 2013/05/21
charts & quotes
- finviz.com
- stubby’s notable screen criteria is based on technical & fundamental parameters.
ranked table of highs
No.1 rank chart and commentary
- this is the first time AHGP has come across my screen. i have no position but will be watching closely. there’s good support @ 60. if it comes in, i may snap up an entry pos.
 o
o
- JPM weekly MACD xUP this week. good entry point.

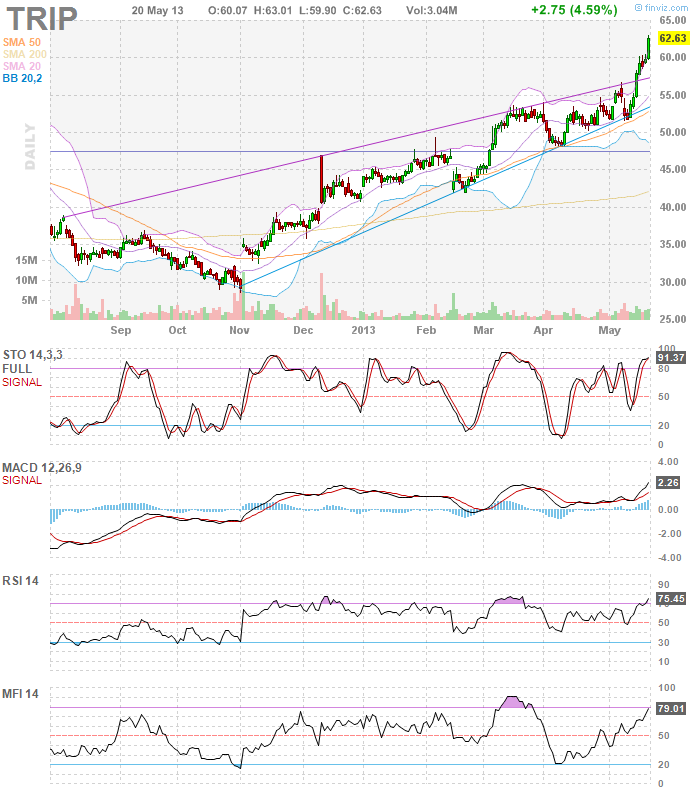
12 new stubbystock HIGHS [EOD20130520] $ACT $ASML $AXP $C $CBRL $CVI $GS $OCN $SAIA $TM $TRIP $VAL
Posted by stubbybrown in 52 week highs on 2013/05/20
charts & quotes
ranked table of highs
No.1 rank chart TRIP and commentary
- this stock recently break out and will let the holding ride. no plans to make any changes till another entry pattern develops.
- all these names in the table above finished positive for the days. other names made highs but finished negative. those were JPM WDR PNC UNF BDC MELI GILD VRTS EXP TYL FEIC.
other setups to watch in todays 52wk highs list
- CVI – breaking out on high volume through a resistance level of 65. i added 1/4 pos today. fresh off of a weekly MACD xUP last week.
- OCN – continuing to move higher after breaking out of a long consolidation on may-10. weekly MACD xUP at breakout. 42.2 was the level i was watching. today closed at 44.31. i bought additional 1/4 a few days after and will maintain neutral for now. still not too late for entry.
- VAL likely to continue to make new new highs after weekly MACD xUP during the week before last. still time for entry this week.
2 notable 52wk HIGHS [EOD20130520] $TM $COG
Posted by stubbybrown in 52 week highs on 2013/05/20
screen results:
- stubby’s screen results @ finviz.com.
- stubby’s screen criteria is based on technical & fundamental parameters.
rank results:


NOTE: stubby is long $TM. no position in $COG
top 5 stubbystock gainers for [EOD20130517] $CVI $KUB $SAIA $CBS $FEIC
Posted by stubbybrown in Top 5 Daily Gainers on 2013/05/17

Economic Report Alert: Payrolls Up in 30 U.S. States in April, Led by Texas via @BloombergNews
Posted by stubbybrown in Economic Reports on 2013/05/17
- Payrolls Increased in 30 U.S. States in April, Led by Texas
- http://bloom.bg/12gF47h
- via @BloombergNews

Economic Report Alert: Leading Indicators Up More Than Expected via @Street_Insider @BloombergNews
Posted by stubbybrown in Economic Reports on 2013/05/17
- April Leading Indicators Rise 0.6% vs 0.2% Expected
- via @Street_Insider
- Leading Indicators Index in U.S. Rises More Than Forecast
- http://bloom.bg/12gDQbZ
- via @BloombergNews

Economic Report Alert: U.S. Consumer Confidence Up via @Street_Insider @BloombergNews
Posted by stubbybrown in Economic Reports on 2013/05/17
- May (P) U.of M Confidence 83.7 vs 77.9 Expected
- via @Street_Insider
- Consumer Sentiment Index in U.S. Rose to 83.7 in May
- http://bloom.bg/12AfUlB
- via @BloombergNews

stubbystock technical alert: morning new highs list $KUB $CVI $SAIA $CBS $VRTS $TRIP $C $TM and more
Posted by stubbybrown in 52 week highs on 2013/05/17
FINVIZ Stock Screener – Custom KUB,CVI,SAIA,CBS,VRTS,TRIP,C,TM,BDC,JPM,WDR,AXP,FEIC,TARO,PNC,MDSO,TYL perfytd
$KUB – daily performance leader of the pack

-
You are currently browsing the archives for May, 2013
Meet Stubby
my name is michael james. my aim is to articulate my wall street trading thesis and methodology as an individual trader. all trading i do is in my own SEP-IRA account. all content i post is for information & opinion purposes only and not intended to be investment advice.
STUBBY RSS FEED


ugly market conditions $SPX $DJIA $COMPQ $STUDY
Posted by stubbybrown in Commentary, Portfolio, Technical Alerts on 2013/05/31
today i unloaded a number positions as it’s possible the market is heading toward a correction (down 10% or more from recent high is technically what a correction amounts to). if i had done nothing, the portfolio only dropped by 0.78% while
this weekend i’ll provide a little detailed analysis and update my portfolio holdings.
COMPQ, DJIA, SPX
7 Comments