stubbybrown
IT support and adjunct CS instructor.
Homepage: https://stubbybrown.wordpress.com
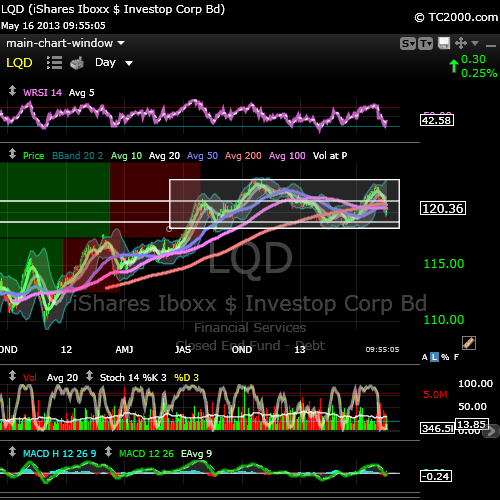
stubby technical alert: $LQD exhibiting head and shoulder
Posted in Technical Alerts on 2013/05/16
$LQD getting a nice bounce today. but beware of head and shoulders that has emerged in the box drawn below.
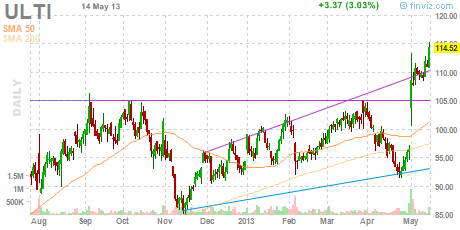
list of 20 stubbystocks making new all time highs: $MDSO $VRTS $TRIP $LFG $URI and more
Posted in 52 week highs, ATH on 2013/05/15
- link to finviz.com charts
- checked against the ATH list @ barchart
- the spreadsheet of todays ATH list:
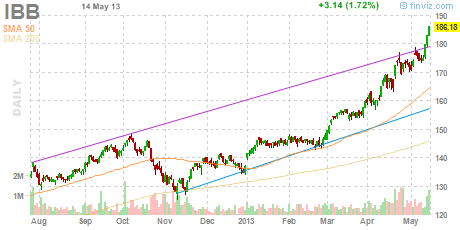
US_Exchanges_All_Time_Highs – 05_15_2013 - stubby stocks making 52wk highs but not all time highs: $AXP $BDC $BMY $CBRL $IBB $JPM $PNC $TM $WAG $XLP
- list below is ranked & sorted by IBD composite rating:
Rank no.,Symbol,Company Name,Composite Rating _,EPS Rating,RS Rating,SMR Rating,Acc/Dis Rating,Group Rel Str Rating
1, MDSO,Medidata Solutions Inc,99,90,98,A,A-,A
2, VRTS,Virtus Investment Ptnrs,99,80,99,A,A,A
3, TRIP,TripAdvisor Inc,99,97,92,A,B+,C+
4, LGF,Lions Gate Entertainment,99,80,97,D,A+,A+
5, URI,United Rentals Inc,98,74,89,A,B-,A-
6, CAB,Cabelas Inc,98,96,94,B,B-,B+
7, GILD,Gilead Sciences Inc,98,77,96,A,A-,A+
8, MIDD,Middleby Corp,98,90,85,A,A-,B+
9, ARMH,A R M Holdings Plc Ads,97,96,94,A,C+,B
10, WDR,Waddell & Reed Finl Cl A,96,90,89,A,C,A
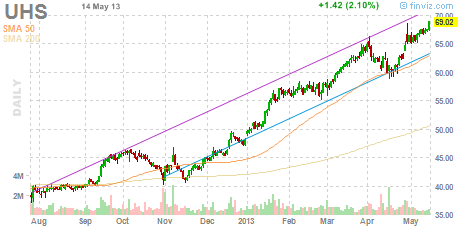
11, UHS,Universal Health Svcs B,96,87,93,B,A-,A+
12, ULTI,Ultimate Software Group,96,97,82,A,B,B
13, SAIA,Saia Inc,95,75,98,C,A+,A
14, ICON,Iconix Brand Group Inc,94,86,94,B,A-,C
15, CBRL,Cracker Barrl Old Cnt St,93,82,89,B,B,A+
16, TDG,Transdigm Group Inc,89,82,70,A,C+,A-
17, JJSF,J & J Snack Foods Corp,87,95,82,B,B+,C+
18, FEIC,F E I Co,85,87,81,B,B+,C-
19, KUB,Kubota Corp Adr,83,74,96,C,C-,B-
20, ASML,A S M L Holding N.V. NY,73,51,82,B,B+,B-
top ranked $MDSO daily stock chart

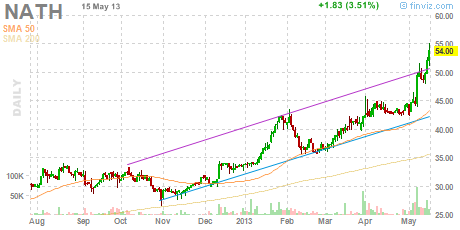
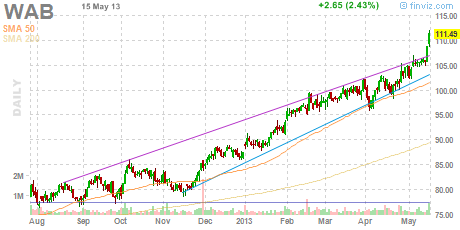
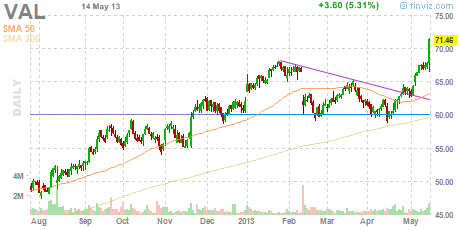
6 notable 52wk HIGHS [EOD20130515] $ADP $GILD $GOOG $NATH $VAL $WAB
Posted in 52 week highs, ATH on 2013/05/15
results: (csv format)
- finviz.com chart list is by alphabetical order. stubby’s ranking is below:
- my screening criteria is based on technical & fundamental parameters i find at finviz.com & IBD investors.com.
- all below made new all time highs.
- $NATH $VAL make the list of 52wk highs and all time highs 2 days in a row.
Rank no.,Symbol,Company Name,Composite Rating,EPS Rating,RS Rating,SMR Rating,Acc/Dis Rating,Group Rel Str Rating
1,GOOG,Google Inc,99,91,83,A,B,A+
2,GILD,Gilead Sciences Inc,98,77,96,A,A-,A+
3,WAB,Wabtec,96,92,85,A,B,A
4,NATH,Nathans Famous Inc,96,84,97,A,A-,A+
5,VAL,Valspar Corp,88,81,83,B,A,B-
6,ADP,Automatic Data Processng,88,70,78,A,A-,B


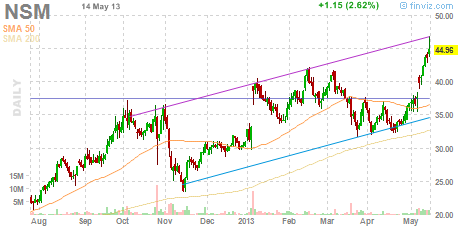
new category: stubby’s ALL TIME HIGH listing: long $AXP $CBRL $CBS $CCI $DDD $DPZ $MDSO $NSM $OCN $TRIP $UHS $ULTI $URI $WDR
Posted in ATH on 2013/05/14
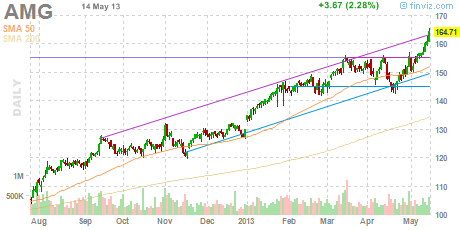
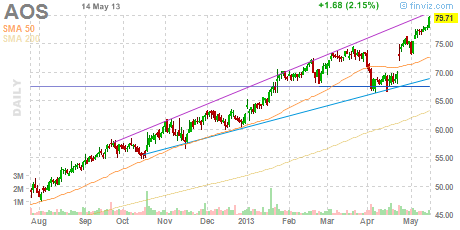
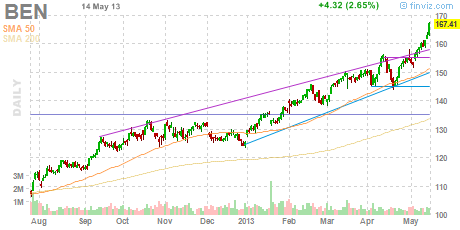
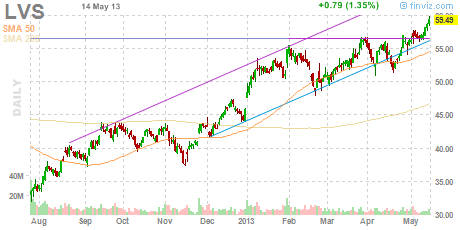
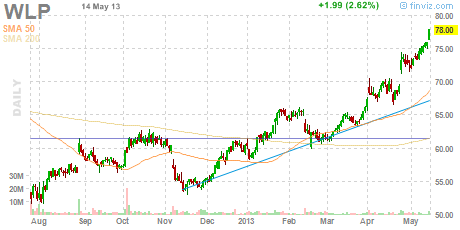
14 notable 52wk HIGHS [EOD20130514] $AMG $AOS $BDX $BEN $BIIB $C $ESGR $IFF $LVS $NATH $SHW $TYL $VAL $WLP
Posted in 52 week highs on 2013/05/14
results: (csv format)
- finviz.com chart list is by alphabetical order. stubby’s ranking is below:
- my screening criteria is based on technical & fundamental parameters i find at finviz.com & IBD investors.com.
Rank no.,Symbol,Company Name,Composite Rating,EPS Rating,RS Rating,SMR Rating,Acc/Dis Rating,Group Rel Str Rating,
1,AMG,Affiliated Managers Grp,99,90,85,A,A-,A,
2,LVS,Las Vegas Sands Corp,99,74,86,A,B,A+,
3,BIIB,Biogen Idec Inc,98,90,94,A,A,A+,
4,BEN,Franklin Resources Inc,97,83,84,A,B+,A,
5,TYL,Tyler Technologies Inc,96,90,92,A,A-,C+,
6,NATH,Nathans Famous Inc,95,85,96,A,A-,A+,
7,AOS,Smith A O Corp,95,91,89,B,A-,B-,
8,IFF,Intl Flavors & Fragrance,93,87,80,B,A+,B,
9,ESGR,Enstar Group Ltd,90,70,81,A,B+,B,
10,SHW,Sherwin-Williams Co,88,87,86,B,B+,B-,
11,VAL,Valspar Corp,88,81,83,B,A,B-,
12,WLP,Wellpoint Inc,88,82,81,C,A,B,
13,C,Citigroup Inc,84,96,91,D,B-,C,
14,BDX,Becton Dickinson & Co,82,78,81,A,A,C-,
brief commentary: the majority of these names are in breakout mode. those that still have some resistance above are likely to take them out sooner than later. i current hold C. i recently sold out of AMG, BEN, BIIB, IFF. it’s been several weeks since i’ve held SHW, VAL, WLP. i’ve no no position in LVS, TYL, NATH, AOS, ESGR. it’s been so long since i’ve held BDX, it may as well be i haven’t held. i’ll be watching SHW & VAL as i am currently light basic materials. will wait though for pullback for better entry.


complete list of stubbystock 52wk high [EOD20130514]
Posted in 52 week highs on 2013/05/14
list of 52wk highs below are in alphabetical order.
$AXP $BDC $C $CBRL $CBS $CCI $DDD $DPZ $GMCR $IBB $MDSO $NSM $OCN $PNC $THC $TRIP$UHS $ULTI $URI $WDR
finviz.com charts by daily performance
finviz.com list by YTD performance
NOTE: i regularly publish a list of notable 52wk highs. the stubbystock designation is for stocks i hold. the notable designation is for stocks that meet my stringent criteria screening process at that particular date of publications. stubbystocks may or may appear in the list of notable 52wk highs as market conditions change since taking on positions.


Economic Report Summary and Futures Outlook for 20130514
Posted in Economic Reports, Futures on 2013/05/14
1) Abnormally cold weather once again pulled down store sales, according to ICSC-Goldman … http://bit.ly/13YhDSi via @BloombergNews
2) More good news out of April is a jump in small business confidence, up 2.6 points to a 92.1 http://bit.ly/19npNUH via @BloombergNews
3) Import prices fell 0.5 percent in April and for a second straight month http://bit.ly/YT3wic via @BloombergNews
4) Rebook reports a sales uptick for chain stores last week http://bit.ly/10LgkXT via @BloombergNews
5) U.S. Stock Futures Rise as Tepper Says He’s Bullish http://bloom.bg/14jp7yM via @BloombergNews
2 notable 52wk highs [EOD20130513] $BEN $VRTS
Posted in 52 week highs on 2013/05/13
results: (csv format)
Rank No.,Symbol,Company Name,Composite Rating,EPS Rating,RS Rating,SMR Rating,Acc/Dis Rating,Group Rel Str Rating,
1,VRTS,Virtus Investment Ptnrs,99,80,98,A,A,A,
2,BEN,Franklin Resources Inc,95,83,84,A,B,A,
brief commentary: both are stocks i have owned recently (no pos now) and like the names. however, both are on steroids right now and i need to wait till they come in a lot before i contemplate starting any new positions.
VRTS

BEN

stubby’s criteria for screening & ranking of notable 52wk highs.
stubbystock technical alert summary [EOD20130502] $FEIC $CBS $MDSO $HCA $SNI $TARO and others
Posted in Technical Alerts on 2013/05/02
- table below is the result of screening my holdings at EOD for the respective bullish technical conditions.

- table below is a histogram of the number of times a stock above populated my screens.
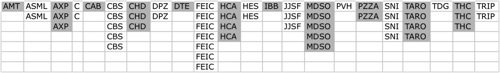
- i use worden TC2000 for the majority of my charting & TA w.r.t. the above. at some point i will post the details of these screens. i’m very picky for the kind of stocks that indicate bullish signals. obviously not all “bulls” are the same and vice-versa with “bears.”
5 notable 52wk highs [EOD20130429] $OII $TARO $BEAV $NKE $RE
Posted in 52 week highs on 2013/04/30


stubbystock technical alert summary [EOD20130429] $VRX $GMCR $SRE $HES and others
Posted in Technical Alerts on 2013/04/29
NOTE: stubbystocks are equities or etfs i hold as of this post. quotes via StockTwits.com
- RSI xUP 5DMA #bullish #signal $VRX $COO $JBHT $SRE $IFF
- 10DMA xUP 20DMA #bullish #signal $GMCR $CP $IYF $UNF
- STOC xUP #bullish #signal $IYK $SRE $CHD
- MACD xUP #bullish #signal $HES
- daily price xUP 10DMA #bullish #signal $CSGP $VRX $GMCR
EDUCATIONAL RESOURCES:
stubby’s notable 52wk high stubbyscreen criteria
Posted in 52 week highs, StubbySelect Screens on 2013/04/29
REVISIONS: may-1-2013: included in my finviz screen, the “change from open” parameter is now set to UP and no longer the screen default of ANY.
NOTE: this screen is for educational purposes only and can be replicated as is with no guarantee or warrantee of any results if used. you will need an IBD account to rank them accordingly.
stubby’s screening method: (the actual instance of the Finviz screen i run at EOD.)
- screen from all 6400+ stocks listed at finfiz.com
- must close above previous 52 wk high
- positive institutional transactions
- short float <5%
- gap up
- performance1 today up
- performance2 YTD +10%
- above 20dma
- above 50dma
- above 200dma
- 52wk high
- relative volume over 100%
- price over $50
- change form open is up (added may-1-2013)
stubby’s ranking criteria using IBD SmartSelect: (you’ll need an IBD account to see all rank criteria.)
- composite rating 80 or greater
- eps rating rating 70 or greater
- rs rating rating 80 or greater
a short-term bearish equity market outlook $SPX $DIA $QQQ
Posted in Commentary, Technical Alerts on 2013/04/27
during the remainder of this quarter, equity markets are likely to be under some selling pressure. this thesis is based on the historical pattern of rising and falling US 30yr T-bond yields which influence equity market sentiment changes from risk-on and risk-off. however longer-term, my outlook toward equities is constructive. the charts i’ve included help illustrate my thesis.
CHART #1 – making the case that longer-term uptrend market sentiment in equities is still intact
- LEGEND:
- US 30yr T-bond yield index $TYX–X (candlestick) vs SP500 $SPX (yellow trace)
- $TYX–X bond yield and $SPX price (y-axis) are logarithmic
- timeframe (x-axis): 1997 to present. each candlestick bar represents a quarter year
- overlays: bond yield index quarterly moving averages 10 (green), 20 (grey), 50( blue), 100 (magenta)
- overlays: bollinger band (light blue)
- pre & post quantitative easing by the federal reserve $FED is demarcated by the white vertical line

- COMMENTARY:
- the 2 white circles (w/red arrows over top the blue curve) to the left of the white line (denoting pre-FED QE) indicate the level of the 30 yr bond yield index $TYX–X when 2 market crashes commenced. bond yields move inversely to bond prices. when institutions, investors and traders start buying 30yr T-bonds at an increasing rate, it’s a good indication sentiment has changed and risk is to the downside for equities. when $TYX–X yield index levels approached the 50 quarter moving average (blue curve), a sell-off in equities commenced as investor sentiment got extremely bearish. the first crash is the familiar DOT COM bubble burst and the second crash is when the federal government let LEHMAN BROTHERS investment banking institution fail.
- in oct-2008 the ripple effect of the LEHMAN failure was so systemic & global in scope, essentially all banks national & foreign stopped lending money to each other over night creating a liquidity freeze. it was later coined that banks of LEHMAN’s size were too big to fail and the treasury & federal reserved stepped in to unfreeze lending to restore market confidence. the correlation between the 50 quarter moving average of the 30yr bond index is coincidental and not causal imo.
- in nov-2008, the federal reserve instituted quantitative easing (QE which entails bond purchases by the federal central bank) drove bond prices up and lowered interest rates aided by even other facilities the $FED rolled out. the intent of the $FED was also to make bond prices so expensive, market participants would stop buying bonds for safety and seek greater capital appreciation potential in the equites market and restore confidence in the financial system.
- knowing that the $FED was underneath everyone else buying bonds, equity capital markets eventually re-gained confidence and investors started selling their bonds. as such bond prices dropped and bond yields rose. notice 2 times after QE commenced, yields approached the 50 quarter moving average mark and equities began selling off again. these events were precipitated by different market events. so increased bond buying commenced by the $FED (extending QE) in an effort once again to confidence.
- the second big drop in equity prices (after QE commenced) was subsequent to the 3 big credit rating agencies lowering the credit worthiness of the US treasury from AAA to AA+, the first ratings drop in recent memory. but after yields dropped to certain levels, the magnitude of bond yield index oscillation has significantly reduced establishing a lid on volatile interest rate changes. note the spread between current bond yield index and it’s 50 quarter moving average has remain wide and relatively flat.
- therefore it is reasonable to conclude that bond yields are not forecasting an imminent crash in the stock market. hence a longer-term bullish market thesis remains intact. however, the relationship between bond yields & equity risk aversion is still an influence on investor sentiment, even on a small scale. using CHART #2 is how i present my short-term bearish equity market thesis.

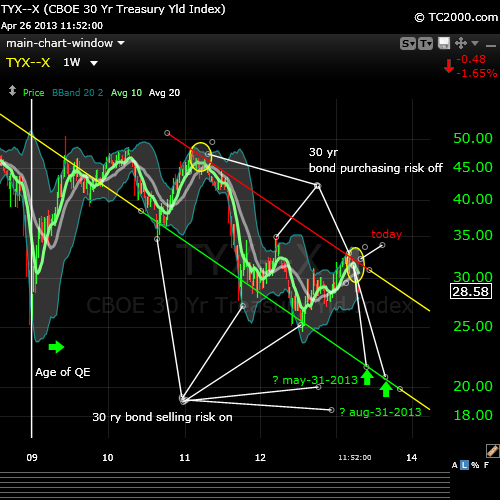
CHART #2 – making the case for short-term equity bearishness and jitters.
- LEGEND
- US 30yr T-bond yield index $TYX–X (candlestick) vs SP500 $SPX (yellow trace)
- $TYX–X bond yield and $SPX price (y-axis) are logarithmic
- timeframe (x-axis): end of 2008 to present. each candlestick bar represents a week.
- overlays: bond yield index weekly moving average 10 (green), 20 (grey)
- overlays: bollinger bands (light blue)
- pre & post quantitative easing by the federal reserve $FED is demarcated by the white vertical line

- COMMENTARY:
- this charts shows another but similar set of trend lines encapsulating the 10 week moving average of the 30 yr T-bond yield index. each time yields begin to drop (indicating increase in bond purchases) there’s a corresponding risk aversion to equities (trace not shown). once the bond yield index peaks and retreats, there’s an increased downward pressure on equity prices. nothing moves in a straight line, though sometimes it may seem so. there can be significant changes from day to day but the moving averages pretty much tells the same story from a market direction standpoint.
- when the 10 week moving average (green) crossed down the 20 week moving average (grey), it was predictable equity markets would drop over a period of several weeks, sometimes months. this pattern occurred all but one time the 10 week & 20 week moving average crossed. right after the 2012 presidential election, the 10 week yield moving average bounced higher off the 20 week moving average as support. today the 10 week moving average is crossing down the 20 week moving average. based on the number of times (5) the 10 week crossed the 20 week moving average, 4 out of five times equity markets took a noticeable breather.
- therefore it is probable and more likely equity markets will fade downward to the point in time (green arrows) bond yields retreat upward. however it is still possible but less likely the 10 & 20 week bond yield moving averages pierce through the upper trend-line and markets begin another leg higher outside the trend.
- all this sounds like weather predictions, i know. but these tools help traders stay alert to potential market sentiment changes in a measured way.
CONCLUSION: i have not begun to short the broader equity market. in the passed there have been a couple of ways i achieved that. (1) through purchasing inverse and inverse leveraged market index etfs OR through purchase of volatility etns. (2) if i don’t short the market but still want some protection, i’ll raise cash ahead of a perceived slow down by taking profits off the table and purchasing various bond related etfs whether treasuries or corp investible bond etfs. recently i’ve taken a higher position in bonds than normal for me in the following bond related etfs: $BOND $LQD $LTPZ $PDI $TLT. they comprise 20% of invested holdings vs 80% equities. and about 22% of my grand total account holdings is cash. let’s see what the future holds over the next 4 – 16 weeks.
Economic Reports this week: Durable Goods Orders, Jobless Claims, GDP #sequestration
Posted in Economic Reports on 2013/04/23
wednesday, apr-24-2013
- Durable Goods Orders to be Released On 4/24/2013 8:30:00 AM For Mar, 2013
- New Orders – M/M change: Prior 5.7 % – Consensus (2.8 %) – Consensus Range (6.0 %) to 0.3 %


thursday, apr-25-2013
- Jobless Claims to be Released On 4/25/2013 8:30:00 AM For wk4/20, 2013
- New Claims – Level: Prior 352 K – Consensus 350 K – Consensus Range 340 K to 360 K


friday, apr-26, 2013
- GDP to be Released On 4/26/2013 8:30:00 AM For Q1:13
- Real GDP – Q/Q change – SAAR: Prior 0.4 % – Consensus 3.1 % – Consensus Range 2.3 % to 3.3 %
- GDP price index – Q/Q change – SAAR: Prior 1.0 % – Consensus 1.4 % – Consensus Range 0.9 % to 1.8 %


Meet Stubby
my name is michael james. my aim is to articulate my wall street trading thesis and methodology as an individual trader. all trading i do is in my own SEP-IRA account. all content i post is for information & opinion purposes only and not intended to be investment advice.
STUBBY RSS FEED


brief trading and market summary for 20130501 $LNKD $TYX $TLT
Posted in 52 week highs, Commentary on 2013/05/01
CBOE 30yr T-bond treasury yield index
notable 52 week highs
trading outlook & equity positions
AMT, ANSS, ASML, AXP, BOND, C, CCI, CHD, DE, DTE, DXPE, GMCR, HES, LNKD, LQD, LTPZ, PAA, PDI, PNC, PVH, TDG, TGI, TLT, TRIP, TYX
Leave a comment