Archive for category 52 week highs
5 notable 52wk highs [EOD20130429] $OII $TARO $BEAV $NKE $RE
Posted by stubbybrown in 52 week highs on 2013/04/30


stubby’s notable 52wk high stubbyscreen criteria
Posted by stubbybrown in 52 week highs, StubbySelect Screens on 2013/04/29
REVISIONS: may-1-2013: included in my finviz screen, the “change from open” parameter is now set to UP and no longer the screen default of ANY.
NOTE: this screen is for educational purposes only and can be replicated as is with no guarantee or warrantee of any results if used. you will need an IBD account to rank them accordingly.
stubby’s screening method: (the actual instance of the Finviz screen i run at EOD.)
- screen from all 6400+ stocks listed at finfiz.com
- must close above previous 52 wk high
- positive institutional transactions
- short float <5%
- gap up
- performance1 today up
- performance2 YTD +10%
- above 20dma
- above 50dma
- above 200dma
- 52wk high
- relative volume over 100%
- price over $50
- change form open is up (added may-1-2013)
stubby’s ranking criteria using IBD SmartSelect: (you’ll need an IBD account to see all rank criteria.)
- composite rating 80 or greater
- eps rating rating 70 or greater
- rs rating rating 80 or greater
6 notable 52wk HIGHS [EOD20130423] $CPA $ECL $TUP $SHW $WHR $PG
Posted by stubbybrown in 52 week highs on 2013/04/23
6 Notable 52wk HIGHS screened & ranked using Finviz & IBD respectively
ticker symbols:
- $CPA $ECL $TUP $SHW $PG $WHR in order of rank. see below for more details.
- these charts & quotes above are provided by finviz.com.
screening method:
- screen from all 6400+ stocks listed at finfiz.com
- must close above previous 52 wk high
- positive institutional transactions
- short float <5%
- gap up
- performance1 today up
- performance2 YTD +10%
- above 20dma
- above 50dma
- above 200dma
- 52wk high
- relative volume over 100%
- price over $50
rank criteria using IBD SmartSelect:
- composite rating 80 or greater
- eps rating rating 70 or greater
- rs rating rating 80 or greater
ranking results: (csv format)
No.,Symbol,Company Name,Composite Rating,EPS Rating,RS Rating,YTD perf
1,CPA,Copa Holdings Sa,99,83,91,23.87%
2,ECL,Ecolab Inc,97,91,81,16.89%
3,TUP,Tupperware Brands Corp,96,91,92,31.40%
4,SHW,Sherwin-Williams Co,89,86,86,18.33%
5,PG,Procter & Gamble,88,70,81,22.57%
6,WHR,Whirlpool Corp,88,79,95,20.45%
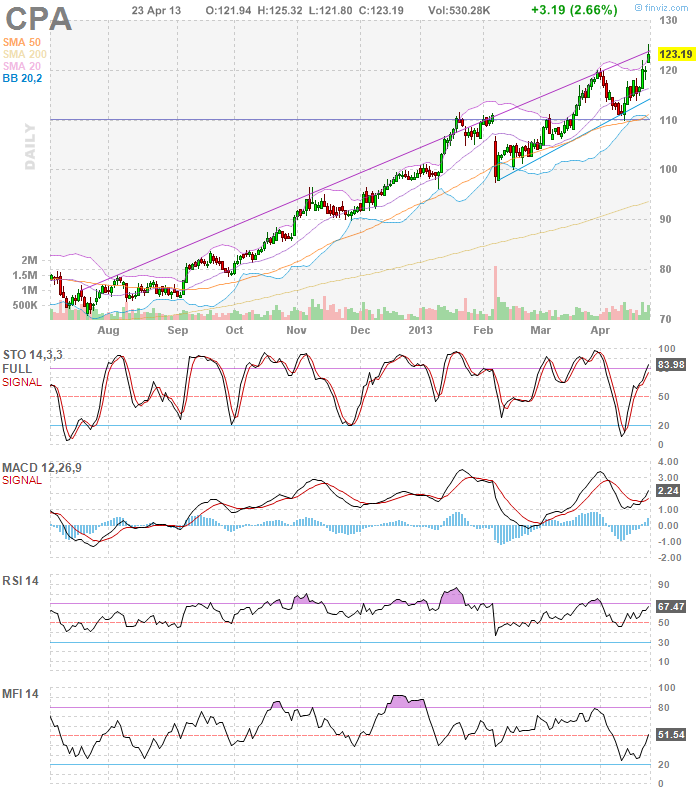
top ranked chart: $CPA
 –
–
stubby’s chart commentary on today’s top rank chart:
- today CPA broke through horizontal resistance @ 120, gapping up on greater than average vol and closed @ 123.19, above it’s previous 52wk high by 0.83%.
- all indicators i watch are rising STOCHASTICS, MACD, RSI(14), MONEY FLOW INDEX, ACCUMULATION, CCI(20).
- the candle formation is characteristic of a shooting star (bearish). however all the other signals overwhelmingly mitigate 1 possible blemish.
- the finviz chart (to the right above) shows CPA in a upward channel trend line with the price at the very top line. because the stock broke out over the horizontal resistance line with a lot of momentum, it would be reasonable to expect the momentum to continue breaking higher above the trend line. in addition to note, previous encounters with the upper trend line were at extremely overbought RSI levels which isn’t the case yet. RSI is 67.46 and anything > 70 is considered hot & overbought but high momentum stocks are known to run up into the high 8o’s before retreating. so we’ll see.
- i am already long CPA 1-1/4 position cost @ 113.2. therefore i intend to remain neutral in this overweight position. my next buy point to consider would likely be when the 100 DMA or 50DMA catches up with the stock price, depending on market sentiment at the time.
upcoming earnings & new analyst ratings:
- AnalystWire Apr. 23 at 7:56 AM JPMorgan Upgrades / Assumes Copa Holdings ($CPA) to Overweight http://stks.co/hSdJ
- CPA earnings are due to be reported on or about may-9-2013.
- CPA – Company Description: PANAMANIAN AIRLINE THAT PROVIDES PASSENGER AND CARGO SERVICES TO 59 DESTINATIONS IN THE AMERICAS AND THE CARIBBEAN.Read More At Investor’s Business Daily: http://research.investors.com/quotes/nyse-copa-holdings-sa-cpa.aspx#ixzz2QxPoJurW Follow us: @IBDinvestors on Twitter | InvestorsBusinessDaily on Facebook
- i am NOT affiliated with finviz.com, investors.com or stocktwits.com. i am a completely independent individual trader.
disclosure(s):
11 stubbystock 52wk highs $BIIB $CELG $AMGN $GILD $ECL $TWX $DIS $VIAB $ABC $SAM $BOND
Posted by stubbybrown in 52 week highs on 2013/04/22
finviz charts http://bit.ly/ZheL2c
stubbystock 52wk highs $CPA $DIS $GILD $HD $HSY $SAM
Posted by stubbybrown in 52 week highs on 2013/04/19
finviz stock quotes & charts – http://bit.ly/11pqoT8
i am long all stubbystock™ mentions.
2 Notable 52wk HIGHS [EOD20130419] $CPA $PG
Posted by stubbybrown in 52 week highs on 2013/04/19
2 Notable 52wk HIGHS i screened for & ranked using Finviz & IBD respectively
ticker symbols:
- $CPA $PG in order of rank. see below for more details.
- these charts & quotes above are provided by finviz.com.
screening method:
- screen from all 6400+ stocks listed at finfiz.com
- must close above previous 52 wk high
- positive institutional transactions
- short float <5%
- gap up
- performance1 today up
- performance2 YTD +10%
- above 20dma
- above 50dma
- above 200dma
- 52wk high
- relative volume over 100%
- price over $50
rank criteria using IBD SmartSelect:
- composite rating 80 or greater
- eps rating rating 70 or greater
- rs rating rating 80 or greater
results: (csv format)
No.,Symbol,Company Name,Composite Rating,EPS Rating,RS Rating
1,CPA,Copa Holdings Sa,99,83,90
2,PG,Procter & Gamble,86,71,81
 –
–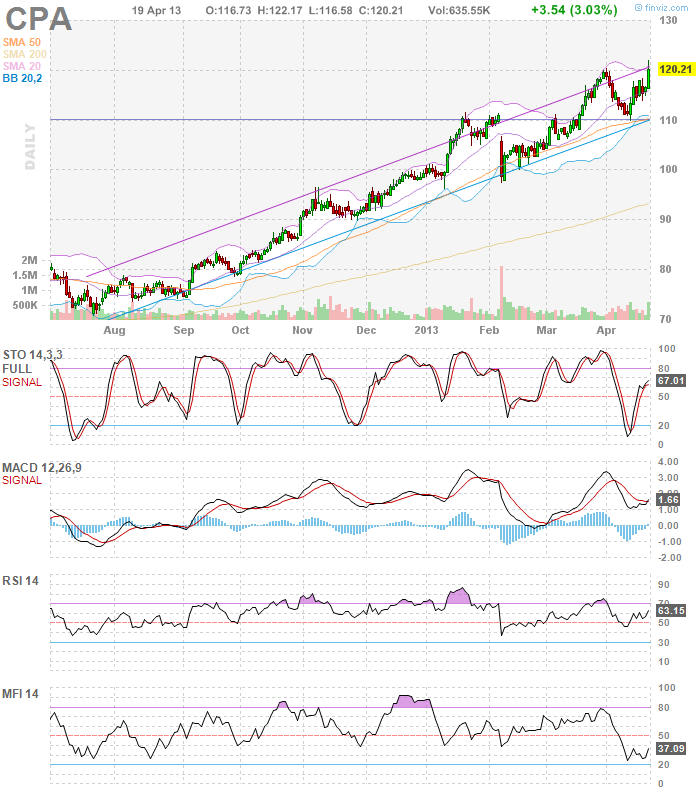
stubby’s chart commentary on today’s top rank chart:
- looking at the primary measures i watch, CPA is on an upswing and looks well positioned to breakout higher above the current close $120.21. today the stock climbed 3.03% setting a new ATH on volume 70% higher than average. MACD xUP signal is positive, RSI is starting to turn higher at a comfortable level of 52.38. not shown , MFI index is turning higher as with the WILLIAM’S A/D & CCI 20day indicators.
- before a breakout is confirmed, look for follow thru in upward price momentum on higher than average volume. i am already long this stock a full position. if it breaks out, i may add another 1/4 long position
- CPA earnings are due to be reported on or about may-9-2013.
- CPA – Company Description: PANAMANIAN AIRLINE THAT PROVIDES PASSENGER AND CARGO SERVICES TO 59 DESTINATIONS IN THE AMERICAS AND THE CARIBBEAN.Read More At Investor’s Business Daily: http://research.investors.com/quotes/nyse-copa-holdings-sa-cpa.aspx#ixzz2QxPoJurW Follow us: @IBDinvestors on Twitter | InvestorsBusinessDaily on Facebook
- i am NOT affiliated with finviz.com, investors.com or stocktwits.com. i am a completely independent individual trader.
disclosure(s):
- I am long full positions in CPA.
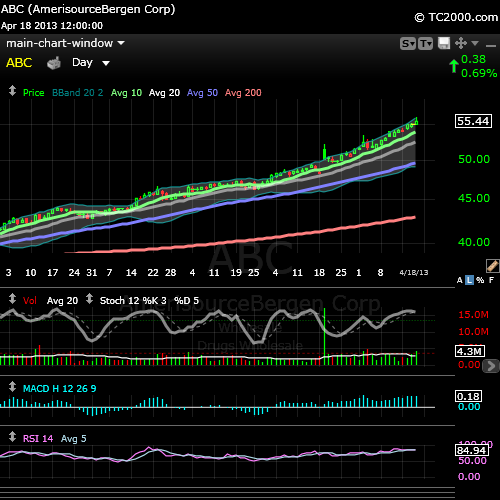
stubbystock 52wk high $ABC closed on above ave vol #neutral
Posted by stubbybrown in 52 week highs on 2013/04/18
Amerisourcebergen Corp $ABC, Company Description: DISTRIBUTES BRAND NAME AND GENERIC DRUGS, OVER-THE-COUNTER HEALTHCARE PRODUCTS AND HOME HEALTHCARE SUPPLIES
~
Symbol,Company Name,IBD Composite Rating,IBD EPS Rating,IBD RS Rating
ABC,Amerisourcebergen Corp,92,92,92
~
Read More At Investor’s Business Daily: http://research.investors.com/quotes/nyse-amerisourcebergen-corp-abc.aspx#ixzz2Qs3Cc7Ee Follow us: @IBDinvestors on Twitter | InvestorsBusinessDaily on Facebook
~
3 Notable 52wk HIGHS [EOD20130416] $REGN $TW $HSY
Posted by stubbybrown in 52 week highs on 2013/04/16
3 Notable 52wk HIGHS i screened for & ranked using Finviz & IBD respectively
ticker symbols:
- $REGN $TW $HSY in order of rank. see below for more details.
- these charts & quotes above are provided by finviz.com.
screening method:
- screen from all 6400+ stocks listed at finfiz.com
- must close above previous 52 wk high
- positive institutional transactions
- short float <5%
- gap up
- performance1 today up
- performance2 YTD +10%
- above 20dma
- above 50dma
- above 200dma
- 52wk high
- relative volume over 100%
- price over $50
rank criteria using IBD SmartSelect:
- composite rating 80 or greater
- eps rating rating 70 or greater
- rs rating rating 80 or greater
results: (csv format)
No.,Symbol,Company Name,Composite Rating ,EPS Rating,RS Rating,
1,REGN,Regeneron Pharmaceutical,99,80,95,
2,TW,Towers Watson & Co,94,75,84,
3,HSY,Hershey Company,90,77,86,
top ranked chart: $REGN
– –
–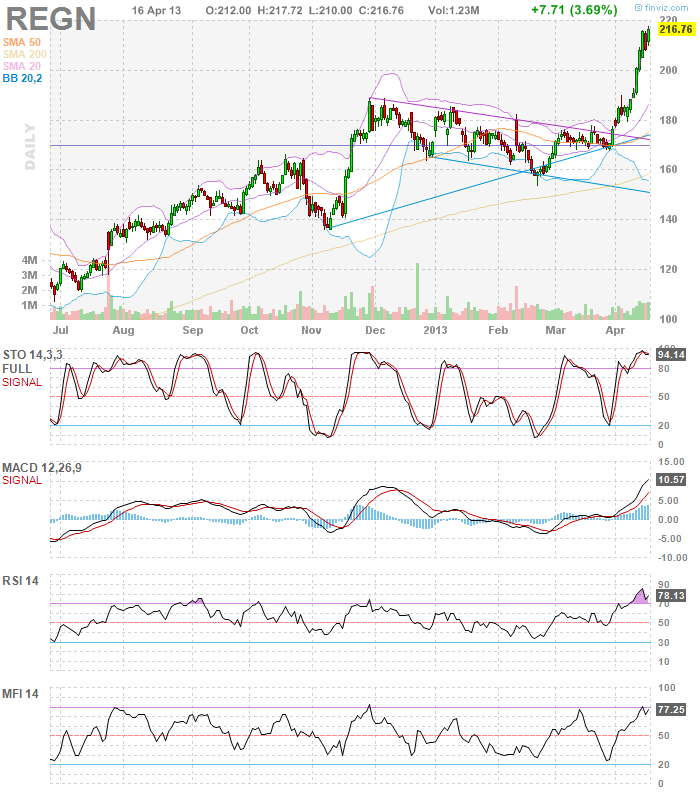
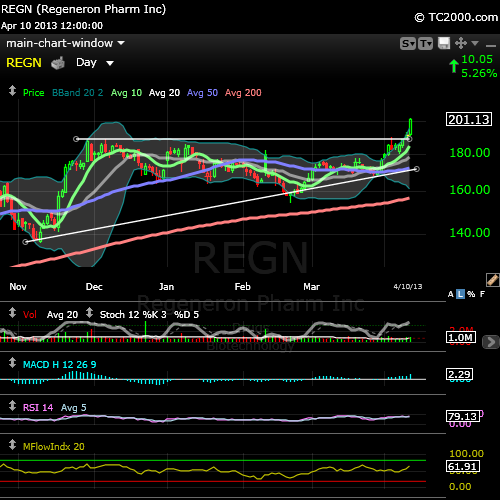
stubby’s chart commentary on today’s top rank chart:
- REGN is a powerful quick momentum stock. by the time it breaks out, it’s almost too late to catch that leg higher. i recently mentioned this stock on apr-10-13. a bearish shooting star candlestick formation developed and i was suspicious of a possible breakout. i put candlestick formation ahead of other technicals i pointed out, stayed out and missed this rally. i suppose worse things have happened. next time i encounter a similar chart pattern, i will be more considerate of ALL the parameters and not let one outweigh all the others.
- since then, some characteristics have developed that give me the impression the recent breakout in REGN has limited upside reward in the short-term. those characteristics are (1) bleeding nose RSI 86.05 and it looks like the daily RSI wants to xBELOW it’s moving average. (2) MACD is approached historical levels where REGN tops out and fades.(3) the same with the MFI (money flow index). (4) william’s A/D is the highest it’s been for over a year. (5) CCI 20day is waving flat.
- so again, i will stay on the sidelines for a better entry with more upside potential. i am [neutral to short-term bearish] on REGN.
disclosure(s):
- I am long full positions in HSY.
3 Notable 52wk HIGHS [EOD20130412] $GILD $BIIB $AMGN
Posted by stubbybrown in 52 week highs on 2013/04/12
3 Notable 52wk HIGHS Screened By Finviz & Ranked By IBD SmartSelect:
ticker symbols:
screening method:
1. first, using these following 13 finviz screen criteria:
- screen from all 6400+ stocks listed at finfiz.com
- must close above previous 52 wk high
- positive institutional transactions
- short float <5%
- gap up
- performance1 today up
- performance2 YTD +10%
- above 20dma
- above 50dma
- above 200dma
- 52wk high
- relative volume over 100%
- price over $50
2. second, i screened the list further using the following IBD criteria:
- composite rating 80 or greater
- eps rating rating 70 or greater
- rs rating rating 80 or greater
rank by my criteria using IBD SmartSelect: (csv format)
No.,Symbol,Company Name,Composite Rating,EPS Rating,RS Rating,
1,GILD,Gilead Sciences Inc,99,74,97,
2,BIIB,Biogen Idec Inc,97,84,94,
3,AMGN,Amgen Inc,97,86,93,
top ranked chart: $GILD
 –
–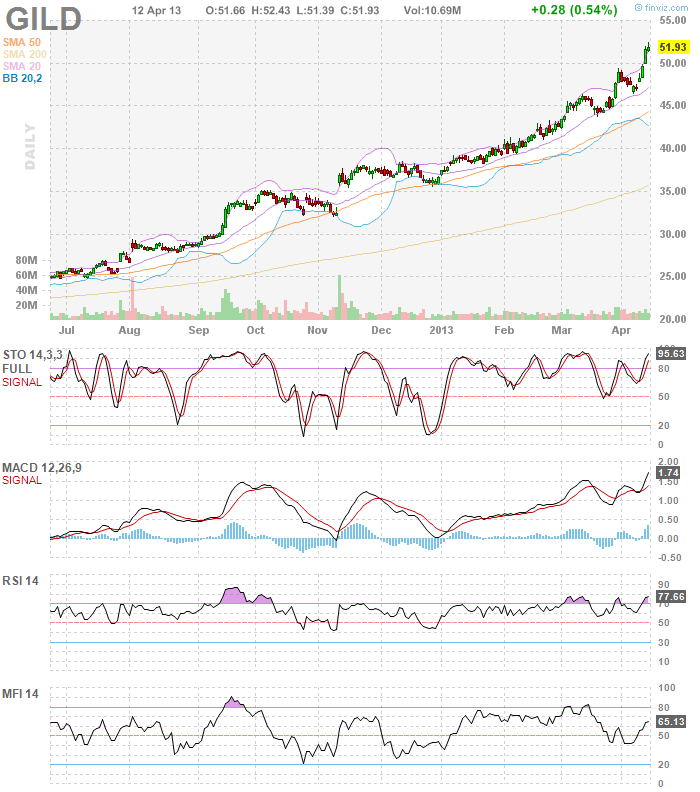
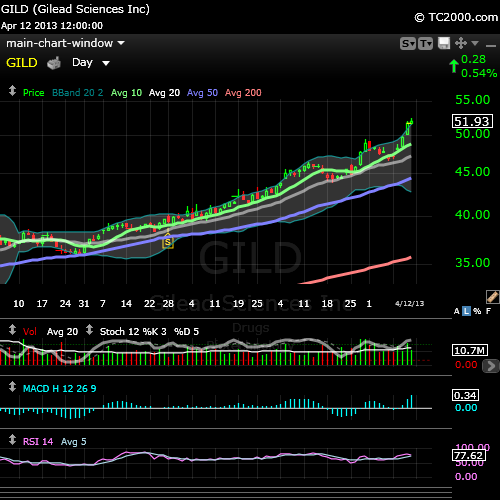
stubby’s chart commentary:
- a re-run from yesterday’s commentary: it’s really hard to put any kind of spin on a stellar stock chart like $GILD. but i’ll try. what i look for is price momentum with rising vol above average, rising RSI (added notes: moving average), rising accumulation and rising money flow. i also like to see a stock gap up over previous day close, making new highs during the day and closing above the previous 52 wk high. $GILD has it all.
- the major difference from today’s chart versus yesterday’s is today’s candlestick formation. yesterday’s candle was a long white formation which indicates strong price momentum higher. today’s candle formation was a white spinning top. typically this indicates sanguine neutrality, particularly in a clear uptrend chart pattern. some may see this as indecision or possible bearish behavior on the part of traders. with all the indications i pointed to in the prior bullet shows this to be buying in moderation in a clear uptrend mode.
- i have a full position in $GILD, cost @ 44.12. $GILD closed today @ 51.96, up 0.54% from yesterday’s close. i have no immediate plans to add to $GILD or trim it. sticking to my thesis this stock and other top biotechs will be market leaders for at least the next 9 – 12 mons. i will re-consider adding to or trimming $GILD after it reports earning later this month on about apr-24-2013.
disclosure(s):
4 Notable 52wk HIGHS [EOD20130411] $GILD $VRTS $TM $PTP
Posted by stubbybrown in 52 week highs on 2013/04/11
4 Notable 52wk HIGHS Screened By Finviz & Ranked By IBD SmartSelect:
ticker symbols:
screening method:
1. first, using these following 12 finviz screen criteria:
- must close above previous 52 wk high
- positive institutional transactions
- short float <5%
- gap up
- performance1 today up
- performance2 YTD +10%
- above 20dma
- above 50dma
- above 200dma
- 52wk high
- relative volume over 100%
- price over $50
2. second, i screened the list further using the following IBD criteria:
- composite rating 80 or greater
- eps rating rating 70 or greater
- rs rating rating 80 or greater
rank by my criteria using IBD SmartSelect: (csv format)
No.,Symbol,Company Name,Composite Rating,EPS Rating,RS Rating
1,GILD,Gilead Sciences Inc,99,74,97
2,VRTS,Virtus Investment Ptnrs,99,80,98
3,TM,Toyota Motor Corp Adr,96,95,86
4,PTP,Platinum Underwriters,87,80,90
top ranked chart: $GILD
 –
–
stubby’s chart commentary:
- it’s really hard to put any kind of spin on a stellar stock chart like $GILD. but i’ll try. what i look for is price momentum with rising vol above average, rising RSI, rising accumulation and rising money flow. i also like to see a stock gap up over previous day close, making new highs during the day and closing above the previous 52 wk high. $GILD has it all.
- i have a full position in $GILD, cost @ 44.12. $GILD closed today @ 51.65. i have no immediate plans to add to $GILD or trim it. sticking to my thesis this stock and other top biotechs will be market leaders for at least the next 9 – 12 mons. i will re-consider adding to or trimming $GILD after it reports earning later this month on about apr-24-2013.
disclosure(s):
11 Notable 52wk HIGHS [EOD20130410] $REGN $BBSI $WDC $VRTS $TM $CSGP $FMX $DIS $ANDE $TMO $SYK
Posted by stubbybrown in 52 week highs on 2013/04/10
11 Notable 52wk HIGHS Screened By Finviz & Ranked By IBD SmartSelect:
ticker symbols:
- $REGN $BBSI $WDC $VRTS $TM $CSGP $FMX $DIS $ANDE $TMO $SYK (in order of rank)
- charts & quotes by finviz.com
screening method:
1. first, using these following 12 finviz screen criteria:
- positive institutional transactions
- short float <5%
- gap up
- performance1 today up
- performance2 YTD +10%
- above 20dma
- above 50dma
- above 200dma
- 52wk high
- relative volume over 100%
- price over $50
- closed above previous 52 wk high
2. second, i screened the list further using the following IBD criteria:
- composite rating 80 or greater
- eps rating rating 70 or greater
- rs rating rating 80 or greater
rank by IBD SmartSelect after screening: (csv format)
No.,Symbol,Company Name,Composite Rating,EPS Rating,RS Rating
1,REGN,Regeneron Pharmaceutical,99,80,90
2,BBSI,Barrett Business Svcs,99,90,98
3,WDC,Western Digital Corp,98,95,91
4,VRTS,Virtus Investment Ptnrs,98,80,98
5,TM,Toyota Motor Corp Adr,97,95,86
6,CSGP,Costar Group Inc,96,93,90
7,FMX,Fomento Econ Mex Sab Ads,95,94,88
8,DIS,Walt Disney Company,91,71,81
9,ANDE,Andersons Inc,88,79,84
10,TMO,Thermo Fisher Scientific,85,86,91
11,SYK,Stryker Corp,80,82,80
top ranked chart: $REGN
stubby’s chart commentary:
- yesterday i included 2 charts of $REGN. however, a classic shooting star candlestick formation lead me to call $REGN bearish. today that proved wrong. i read the sentiment of the candlestick over the other more bullish chart features i discussed. i also read the sentiment of the whole market incorrectly bearish.
- i hold no position in $REGN and don’t plan on getting in considering i am already up $AMGN $BIIB $CELG & $GILD. i will reconsider $REGN after another correction in the stock.
disclosure(s):
2 Notable 52wk HIGHS [EOD20130409] $REGN $FMX $$
Posted by stubbybrown in 52 week highs on 2013/04/09
2 Notable 52wk HIGHS Screened & Ranked By IBD SmartSelect:
ticker symbols:
rank by IBD SmartSelect after screening: (csv format)
No.,Symbol,Company Name,Composite Rating,EPS Rating,RS Rating,
1,REGN,Regeneron Pharmaceutical,99,80,90,
2,FMX,Fomento Econ Mex Sab Ads,95,94,88,
top ranked chart: $REGN


stubby’s chart commentary:
- i included 2 charts of $REGN. i prefer the trend lines as i drew them (right) versus finviz (left). $REGN has been lagging the pack of biotech stocks i hold such as $AMGN, $BIIB, $CELG, $GILD. so it looks like $REGN wants a piece of the action. i don’t hold $REGN but have in the passed. as i drew the trend lines, price action indicates $REGN gapped over resistance and finished above on strong volume. however, todays candle stick looks to me like a classic bearish shooting star.
- therefore i will pass on buying $REGN until a better setup develops. the S&P 500 broad index suffered the same fate and am not positive about equity prospects in general.
screening method:
1. first, using these following 12 finviz screen criteria:
- positive institutional transactions
- short float <5%
- gap up
- performance1 today up
- performance2 YTD +10%
- above 20dma
- above 50dma
- above 200dma
- 52wk high
- relative volume over 100%
- price over $50
- closed above previous 52 wk high
2. second, i screened the list further using the following IBD criteria:
- composite rating 80 or greater
- eps rating rating 70 or greater
- rs rating rating 80 or greater
disclosure(s):
- i do not hold $REGN or $FMX.
3 Notable 52wk HIGHS [EOD20130408] $SYNT $DIS $TM $$
Posted by stubbybrown in 52 week highs on 2013/04/08
3 Notable 52wk HIGHS Screened & Ranked By Desc % YTD Price Performance:
ticker symbols:
- $SYNT $DIS $TM (<— quotes by stocktwits.com)
- http://bit.ly/150rha2 (<— charts finviz.com)
rank by performance %YTD after screening: (csv format)
No.,Ticker,Company,Sector,Industry,Country,Market Cap,Perf YTD,Price,Change
1,SYNT,”Syntel, Inc.”,Technology,Information Technology Services,USA,2.85B,26.72%,67.96,0.50%
2,DIS,Walt Disney Co.,Services,Entertainment – Diversified,USA,106.20B,18.14%,58.82,1.94%
3,TM,Toyota Motor Corporation,Consumer Goods,Auto Manufacturers – Major,Japan,187.42B,16.58%,108.71,2.08%
DAILY TOP RANKED Chart: SYNT

STUBBY’S COMMENTARY:
- this is an interesting stock chart. there was a big dip in price leading up to the beginning in 2013. a cursory thought is the stock began to fade during all the 2012 presidential election noise & then sequestration noise hammered it down further. but it’s also evident the stock was backfilling a gap up in price from earlier in the year of 2012. before stepping, i want to see the price breakout from here on solid above average volume. the strong fundamentals and TA indicators show there’s a little more room to run higher in the short-term. then i will expect a pause in price gain while the 50DMA catches back up with the stock price.
- as a position trader, the setup would be for me to enter with a starting 1/2 position if the stock breaks out on high volume. the next position to look for would be to wait till the 50DMA catches up with the price. a flat base or cup-n-handle formation may develop. at the conclusion of that pause development is closer to the time for me to consider taking a 1/4 position. i am not long SYNT but may consider taking an entry position in the next 72 hours if the senario i sketched out unfolds.
screening method:
1. first, using these following 11 finviz screen criteria:
- positive institutional transactions
- short float <5%
- gap up
- performance1 today up
- performance2 YTD +10%
- above 20dma
- above 50dma
- above 200dma
- 52wk high
- relative volume over 100%
- price over $50
2. second, i screened the list further using the following IBD criteria:
- composite rating 80 or greater
- eps rating rating 70 or greater
- rs rating rating 80 or greater
3. third, ranked the resulting list by %YTD price performance.
disclosure(s):
2 Notable 52wk HIGHS [EOD20130404] $TFX $MON $$
Posted by stubbybrown in 52 week highs on 2013/04/04
2 Notable 52wk HIGHS Screened & Ranked By Desc % YTD Price Performance:
ticker symbols:
TFX MON (<— quotes by stocktwits.com)
rank by performance %YTD after screening:
No.,Ticker,Company,Sector,Industry,Country,Market Cap,Perf YTD,Price,Change
1,TFX,Teleflex Incorporated,Healthcare,Medical Instruments & Supplies,USA,3.50B,20.14%,85.31,0.98%
2,MON,Monsanto Co.,Basic Materials,Agricultural Chemicals,USA,56.66B,12.56%,105.74,1.18%
http://bit.ly/10AoWN6 (<— finviz.com charts & news)
screening method:
1. first, using these following 11 finviz screen criteria:
- positive institutional transactions
- short float <5%
- gap up
- performance1 today up
- performance2 YTD +10%
- above 20dma
- above 50dma
- above 200dma
- 52wk high
- relative volume over 100%
- price over $50
2. second, i screened the list further using the following IBD criteria:
- composite rating 80 or greater
- eps rating rating 70 or greater
- rs rating rating 80 or greater
3. third, ranked the resulting list by %YTD price performance.
disclosure: i am long TFX
6 Notable 52wk HIGHS [EOD20130402]
Posted by stubbybrown in 52 week highs on 2013/04/02
6 Notable 52wk HIGHS Screened & Ranked By Desc % YTD Price Performance:
ticker symbols: FLT, BIIB LIFE BDX RYN DVA (<— quotes by stocktwits.com)
rank by %YTD performance after screening: http://bit.ly/12eoCVv (<— finviz.com charts & news)
- + 45.07% YTD, FLT, FleetCor Technologies, Inc.
- + 35.40% YTD, BIIB, Biogen Idec Inc.
- + 34.10% YTD, LIFE, Life Technologies Corporation
- + 24.20% YTD, BDX, Becton Dickinson and Company
- + 15.32% YTD, RYN, Rayonier Inc.
- + 15.08% YTD, DVA, DaVita, Inc.
screening method:
1. first, using these following 11 finviz screen criteria:
- positive institutional transactions
- short float <5%
- gap up
- performance1 today up
- performance2 YTD +10%
- above 20dma
- above 50dma
- above 200dma
- 52wk high
- relative volume over 100%
- price over $50
2. second, i screened the list further using the following IBD criteria:
- composite rating 80 or greater
- eps rating rating 70 or greater
- rs rating rating 80 or greater
3. third, ranked the resulting list by %YTD price performance.
-
You are currently browsing the archives for the 52 week highs category.
Meet Stubby
my name is michael james. my aim is to articulate my wall street trading thesis and methodology as an individual trader. all trading i do is in my own SEP-IRA account. all content i post is for information & opinion purposes only and not intended to be investment advice.
STUBBY RSS FEED

